Radio Soil Sensor
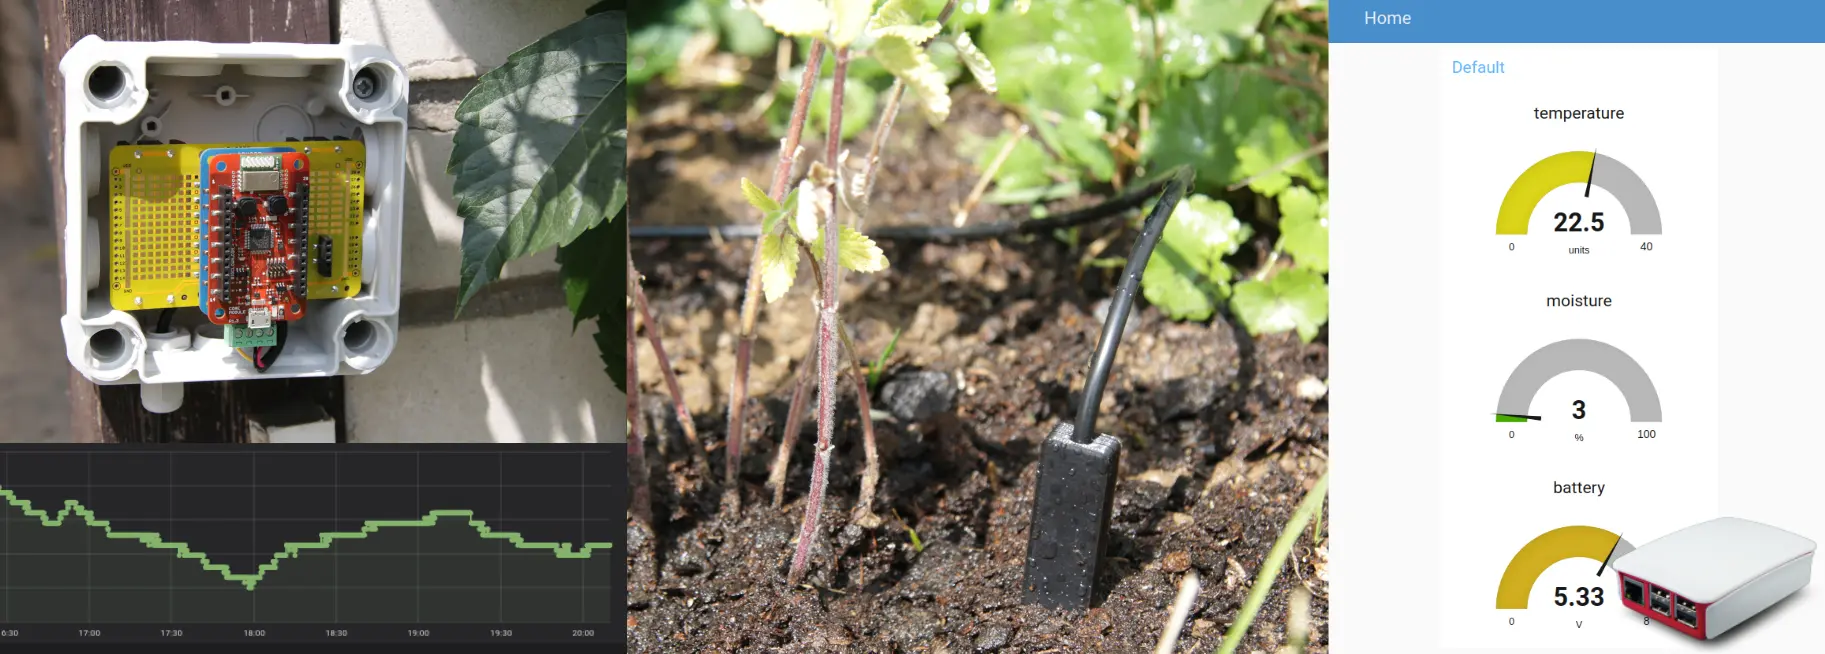
This guide walks you through the Radio Soil Sensor project. You'll view, store and analyze soil moisture and temperature in Node-RED and in the Grafana visualization tool.
Video Tutorial
Playing the video loads it from YouTube (Google).
Block Diagram

Requirements
-
Either the Soil Sensor Set or these individual components:
- 1x Soil Moisture Sensor
- 1x Sensor Module
- 1x Core Module
- 1x Battery Module
- 1x Radio Dongle
-
You'll need a Raspberry Pi with the HARDWARIO Raspbian distribution installed. See Raspberry Pi Installation for instructions.
The measured data is stored and visualized in Grafana on the Raspberry Pi. You can also use your computer instead; just follow Playground Installation.
Connecting to the Raspberry Pi
You'll do all the configuration, run the services and flash the firmware on the Raspberry Pi. Your computer only connects to the Raspberry Pi SSH server and the Grafana web interface.
Follow the Raspberry Pi Login guide, which shows how to find the Raspberry Pi IP address on your network and connect to the SSH server.
Firmware Upload
You'll upload the firmware to the Core Module with the HARDWARIO Firmware Tool: connect the module to the Raspberry Pi and flash the firmware from there.
Now flash the firmware to the Core Module.
Step 1: Connect the Core Module to the Raspberry Pi with a Micro USB cable
Step 2: Upload the firmware to the Core Module
If some time has passed since you installed the system, you may want to update the list of available firmware with bcf update.
Flashing Core Module R1 and R2 The older Core Module 1 and the newer Core Module 2 are flashed differently; see Core Module R1 and R2 comparison in the Hardware section.
On the Raspberry Pi, flash the firmware with the HARDWARIO Firmware Tool:
bcf flash hardwario/twr-radio-soil-sensor:latest
Step 3: Disconnect the Micro USB cable from the Core Module and the Raspberry Pi
Your firmware is now uploaded.
Hardware Assembly
Step 1: Start with the Battery Module
Check that there are no batteries in the Battery Module.
Step 2: Plug the Core Module onto the Battery Module
Step 3: Plug the Sensor Module onto the Core Module
Step 4: Plug the Soil Moisture Sensor connector into the Sensor Module
Radio Pairing
In this section, we'll establish a radio link between the Radio Dongle and the Radio Soil Sensor.
In Node-RED, follow these steps:
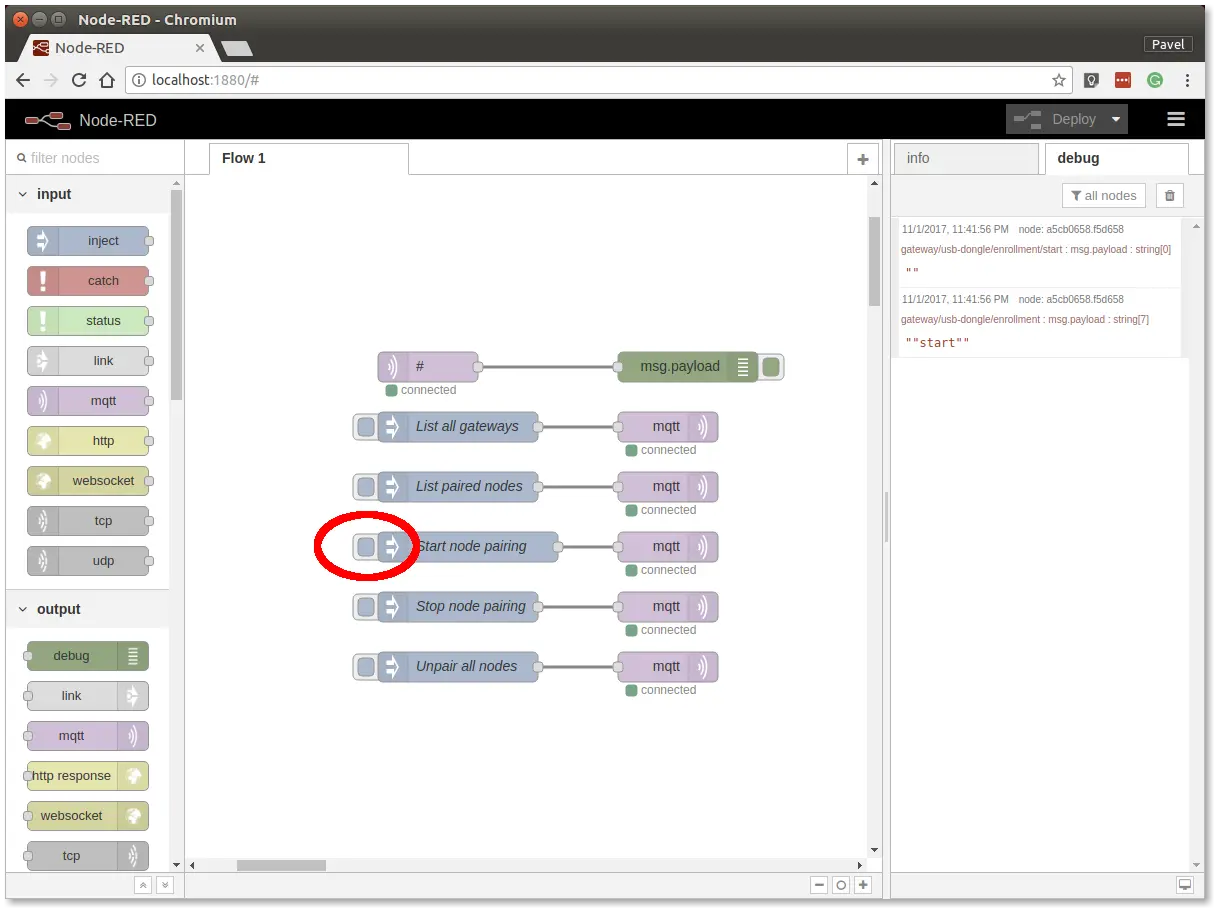
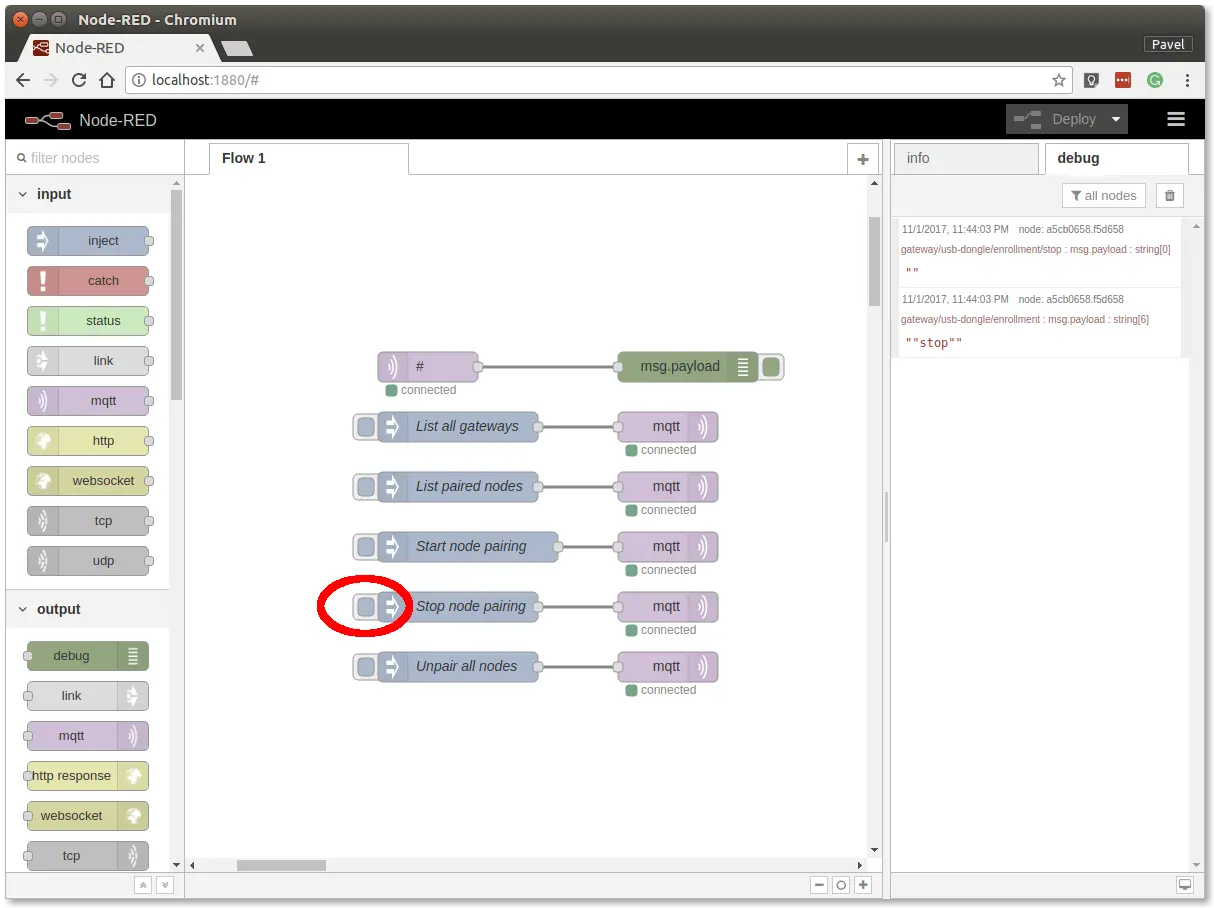
Step 1: Click the Start node pairing button
After you click Start node pairing, check that the debug tab on the right shows two messages: the command, and the response from the Radio Dongle with "start".
Step 2: Power up the assembly
Insert the batteries into the Radio Soil Sensor to send the pairing request (the red LED on the Core Module should also light up for about 2 seconds).
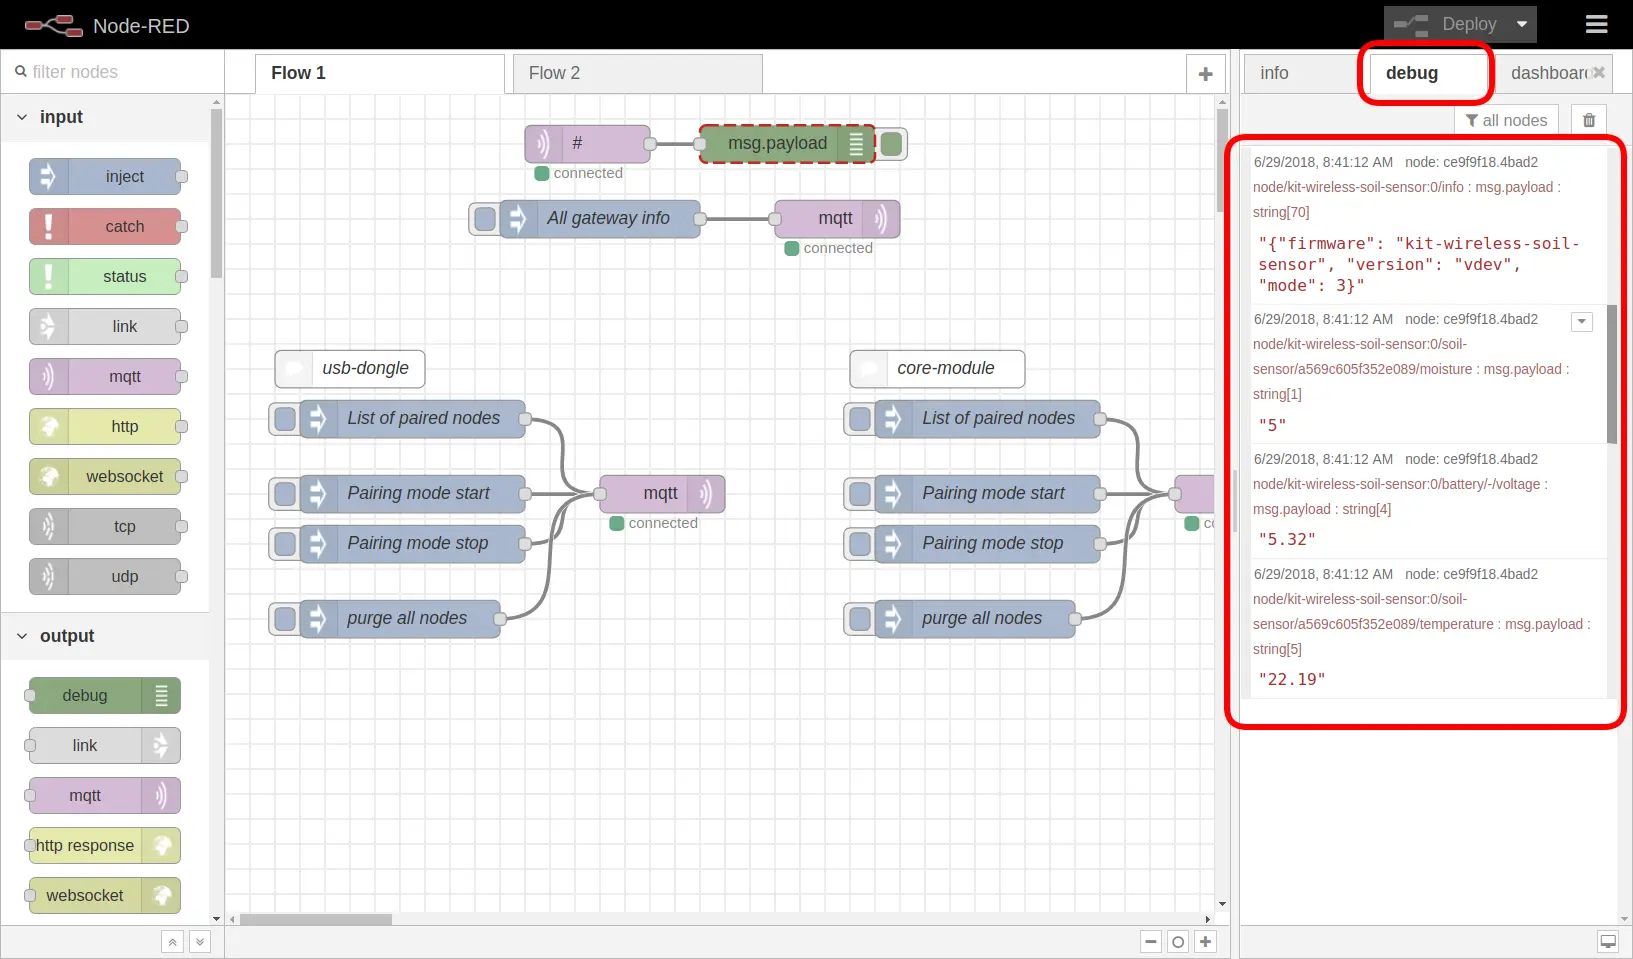
The Node-RED debug tab shows a message with the name and firmware version of the newly paired module.
Step 3: Click the Stop node pairing button
You now have a radio link between the node (Radio Soil Sensor) and the gateway (Radio Dongle).
Communication Test
In Node-RED, follow these steps:
Step 1: Switch to the debug tab on the right
Step 2: Test the transmission
Breathe on the temperature sensor of the Soil Sensor. The change in temperature triggers a radio transmission.
You should then see messages like these:
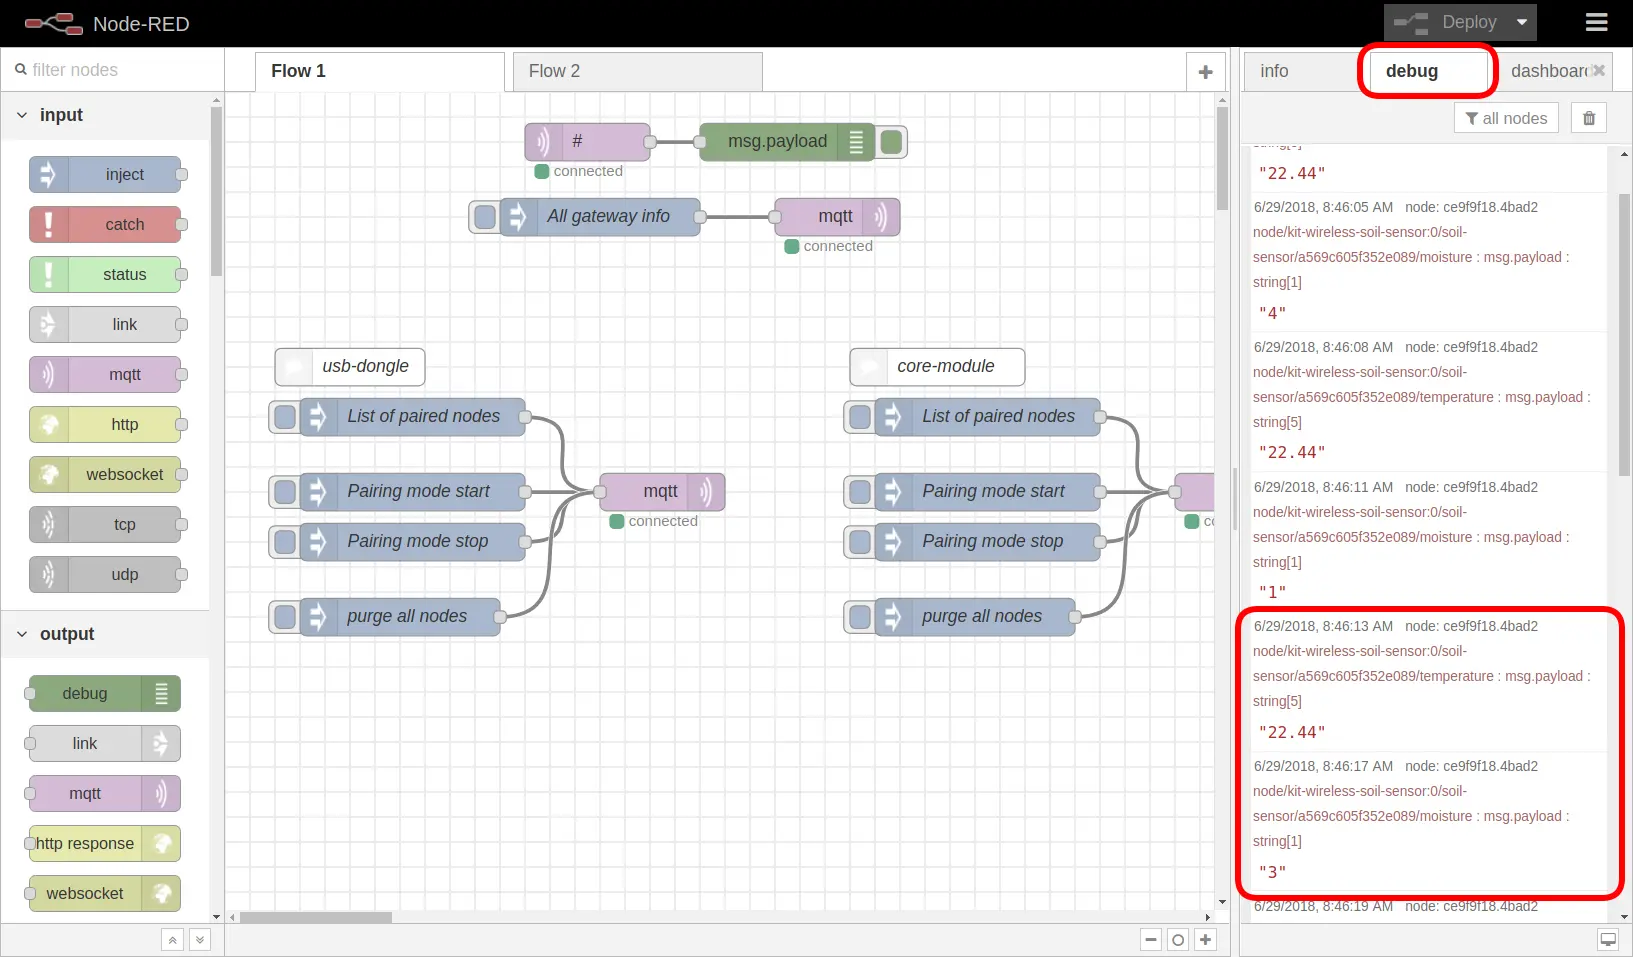
Radio communication is now verified.
Enclosure
If you have a suitable enclosure, you can put the assembly into it.
You'll find enclosures for TOWER kits in the Enclosures category of the HARDWARIO Store.
Grafana Integration
With the kit assembled, let's set up a basic integration with Grafana.
Step 1: Install dependencies
Install Grafana and the InfluxDB database on your Raspberry Pi as described in Grafana Visualization.
Step 2: Edit config
Add the following lines to the /etc/bigclown/mqtt2influxdb.yml configuration file you created in the Grafana Visualization guide. They add support for the new topics that the Soil Sensor sends.
We edit text in the nano editor. Save your changes with Ctrl + O and exit the editor with Ctrl + X.
Open the mqtt2influxdb configuration in the nano text editor.
sudo nano /etc/bigclown/mqtt2influxdb.yml
Append these lines to the end of the existing file:
  - measurement: moisture
    topic: node/+/soil-sensor/+/moisture
    fields:
      value: $.payload
    tags:
      id: $.topic[1]
      channel: $.topic[3]

  - measurement: temperature
    topic: node/+/soil-sensor/+/temperature
    fields:
      value: $.payload
    tags:
      id: $.topic[1]
      channel: $.topic[3]
Step 3: Check that the configuration is valid. If it is not, the YAML file has a formatting error
mqtt2influxdb -c /etc/bigclown/mqtt2influxdb.yml --test
Step 4: Restart the MQTT2InfluxDB service so it loads the changed configuration
pm2 restart mqtt2influxdb
Step 5: Open Grafana, which runs on the Raspberry Pi on port 3000
Step 6: Graph
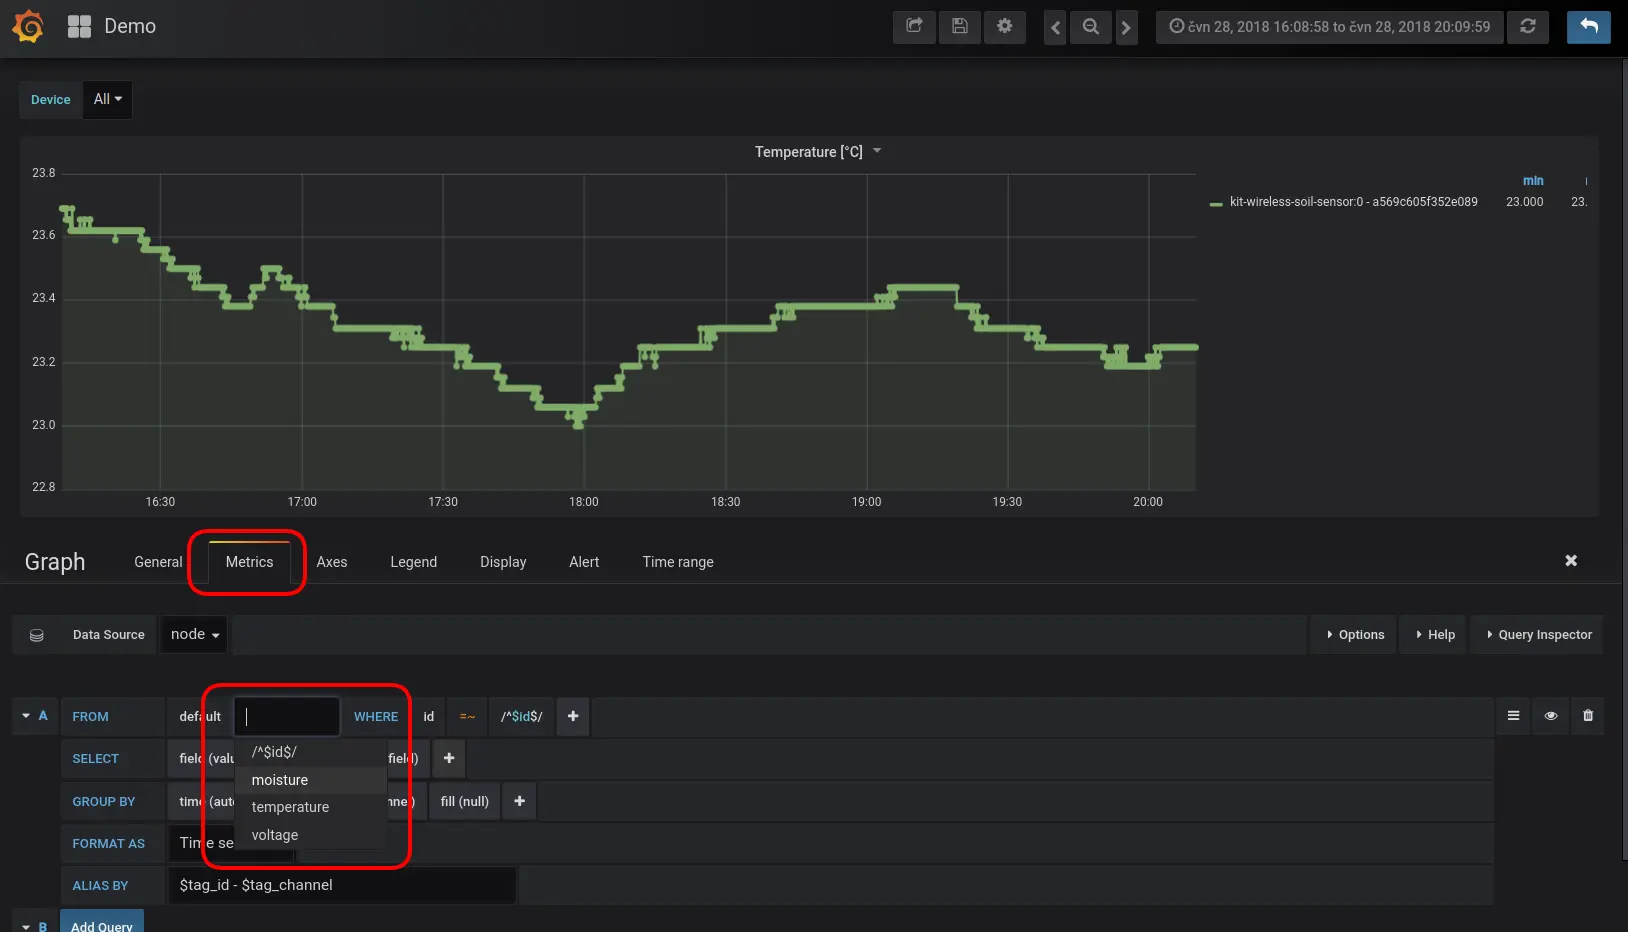
At the bottom you can now see the temperature and battery voltage. What's missing is a moisture graph. Since we added - measurement: moisture to the configuration file, duplicate an existing graph and change its measurement data source to moisture.

Then click Edit on the duplicated graph.

On the Metrics tab, change FROM from temperature to moisture.
Step 7: Save
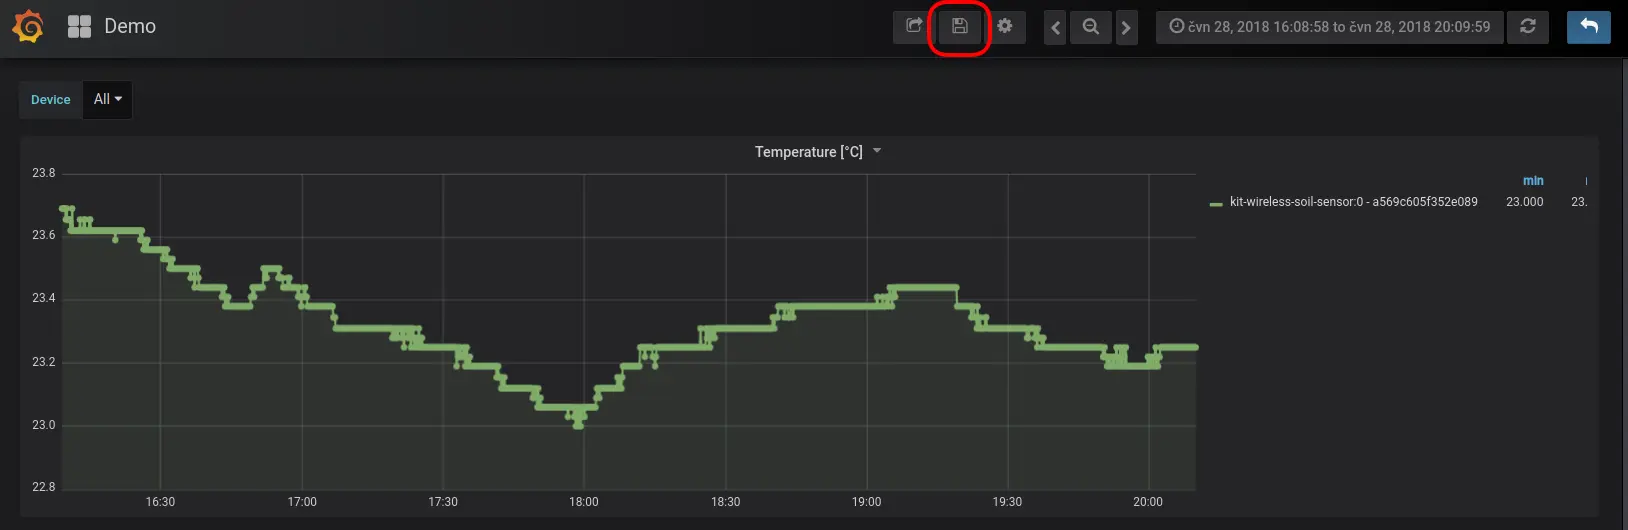
Finally, click Save in Grafana so your configuration is still there the next time you open the page.