Iguana terrarium monitor
Introduction
Whether you keep an iguana, a turtle, a snake or a gecko, you want it to feel as comfortable as possible at your place. 👌🦎 Monitor the climate in the terrarium and find out whether your green friend has ideal living conditions.
In this project, you will learn to measure four climate values and show them in charts: temperature, humidity, illuminance and air pressure. As a reward, your green friends might tell you a few stories about their dinosaur ancestors. 🦖 Or something like that.
If you already have the Start Set, you will also need the Climate Module. The Clime Set has everything you need.
Prepare the box
-
Assemble and pair the Clime Set. If this is your first time, we have a simple guide for you; the steps are the same as for the Start Set. The Core Module needs the twr-radio-climate-monitor firmware. If you don't know how to get the firmware or what it is, you'll find out here.
-
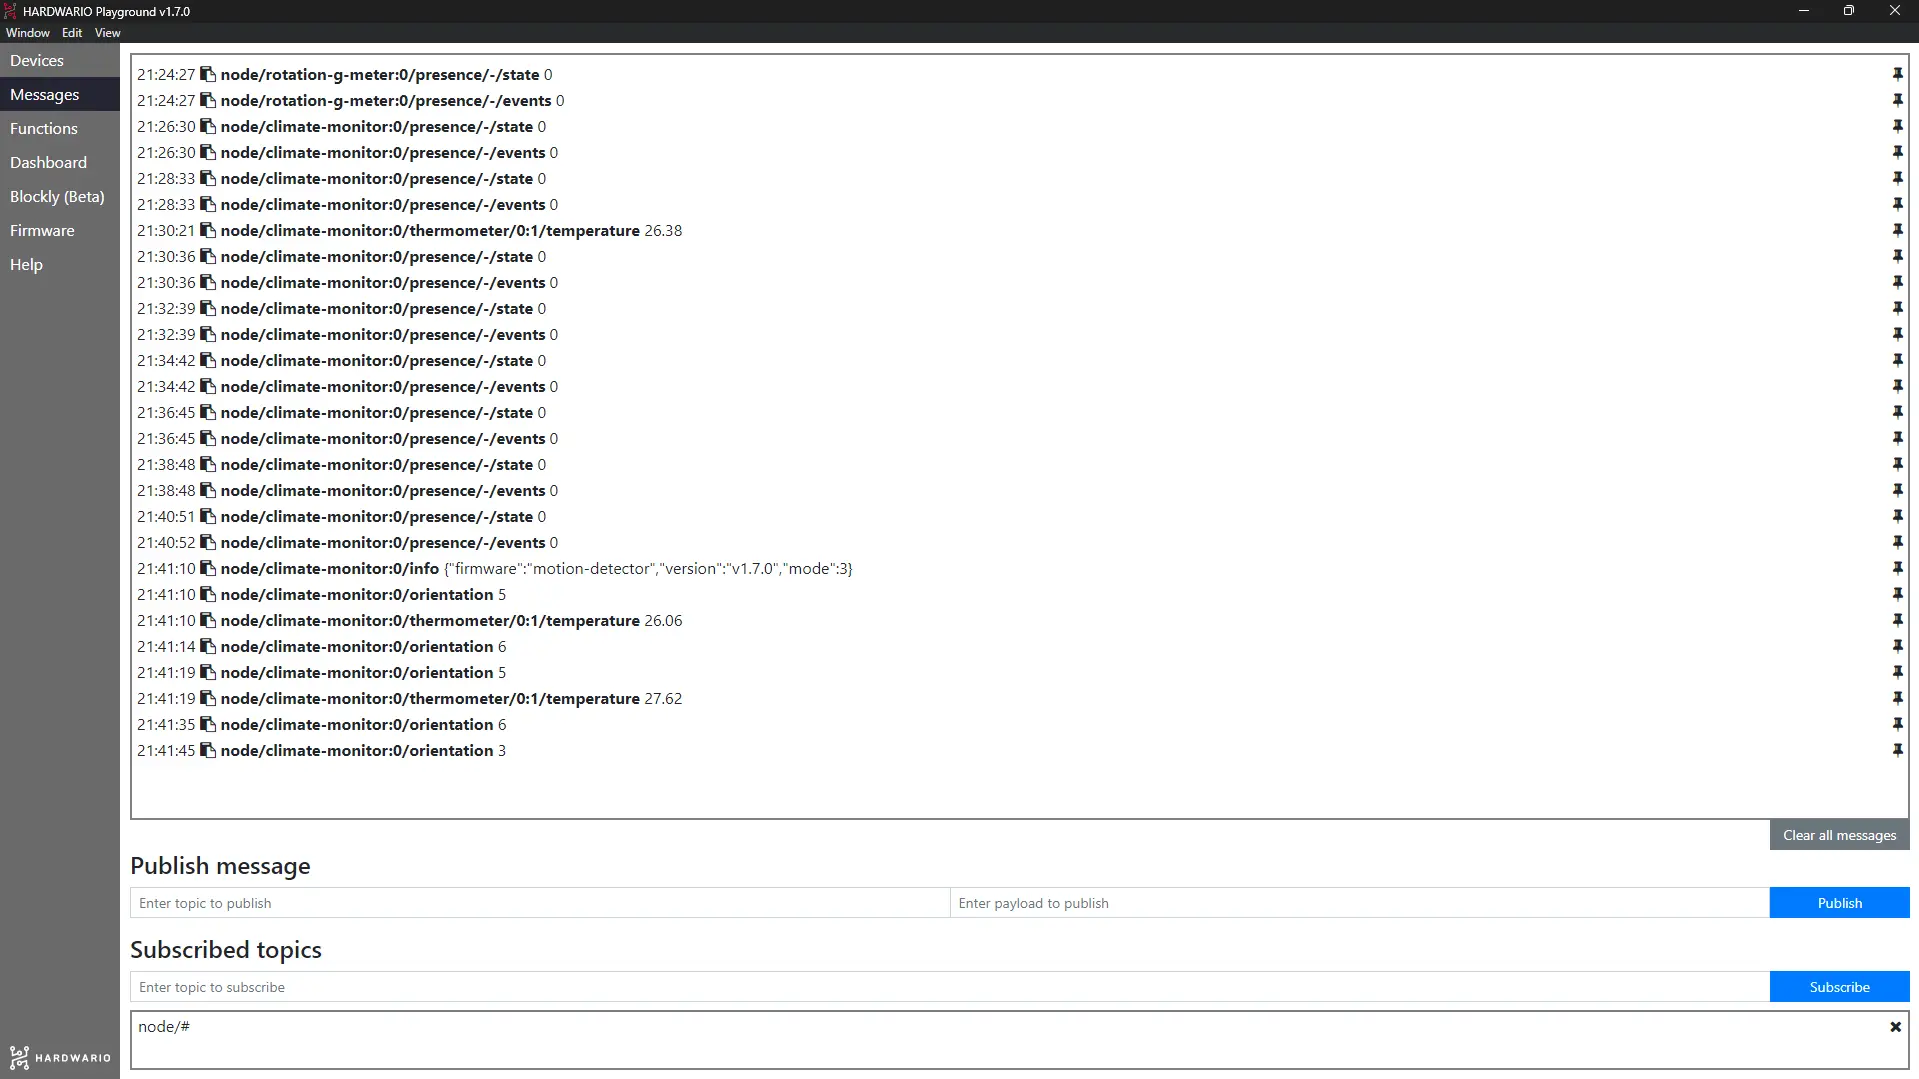
You'll see the temperature, illuminance, humidity and air pressure change in the Messages tab in Playground.
Set up Node-RED
-
You'll program in Node-RED. First, click the Functions tab in Playground.
-
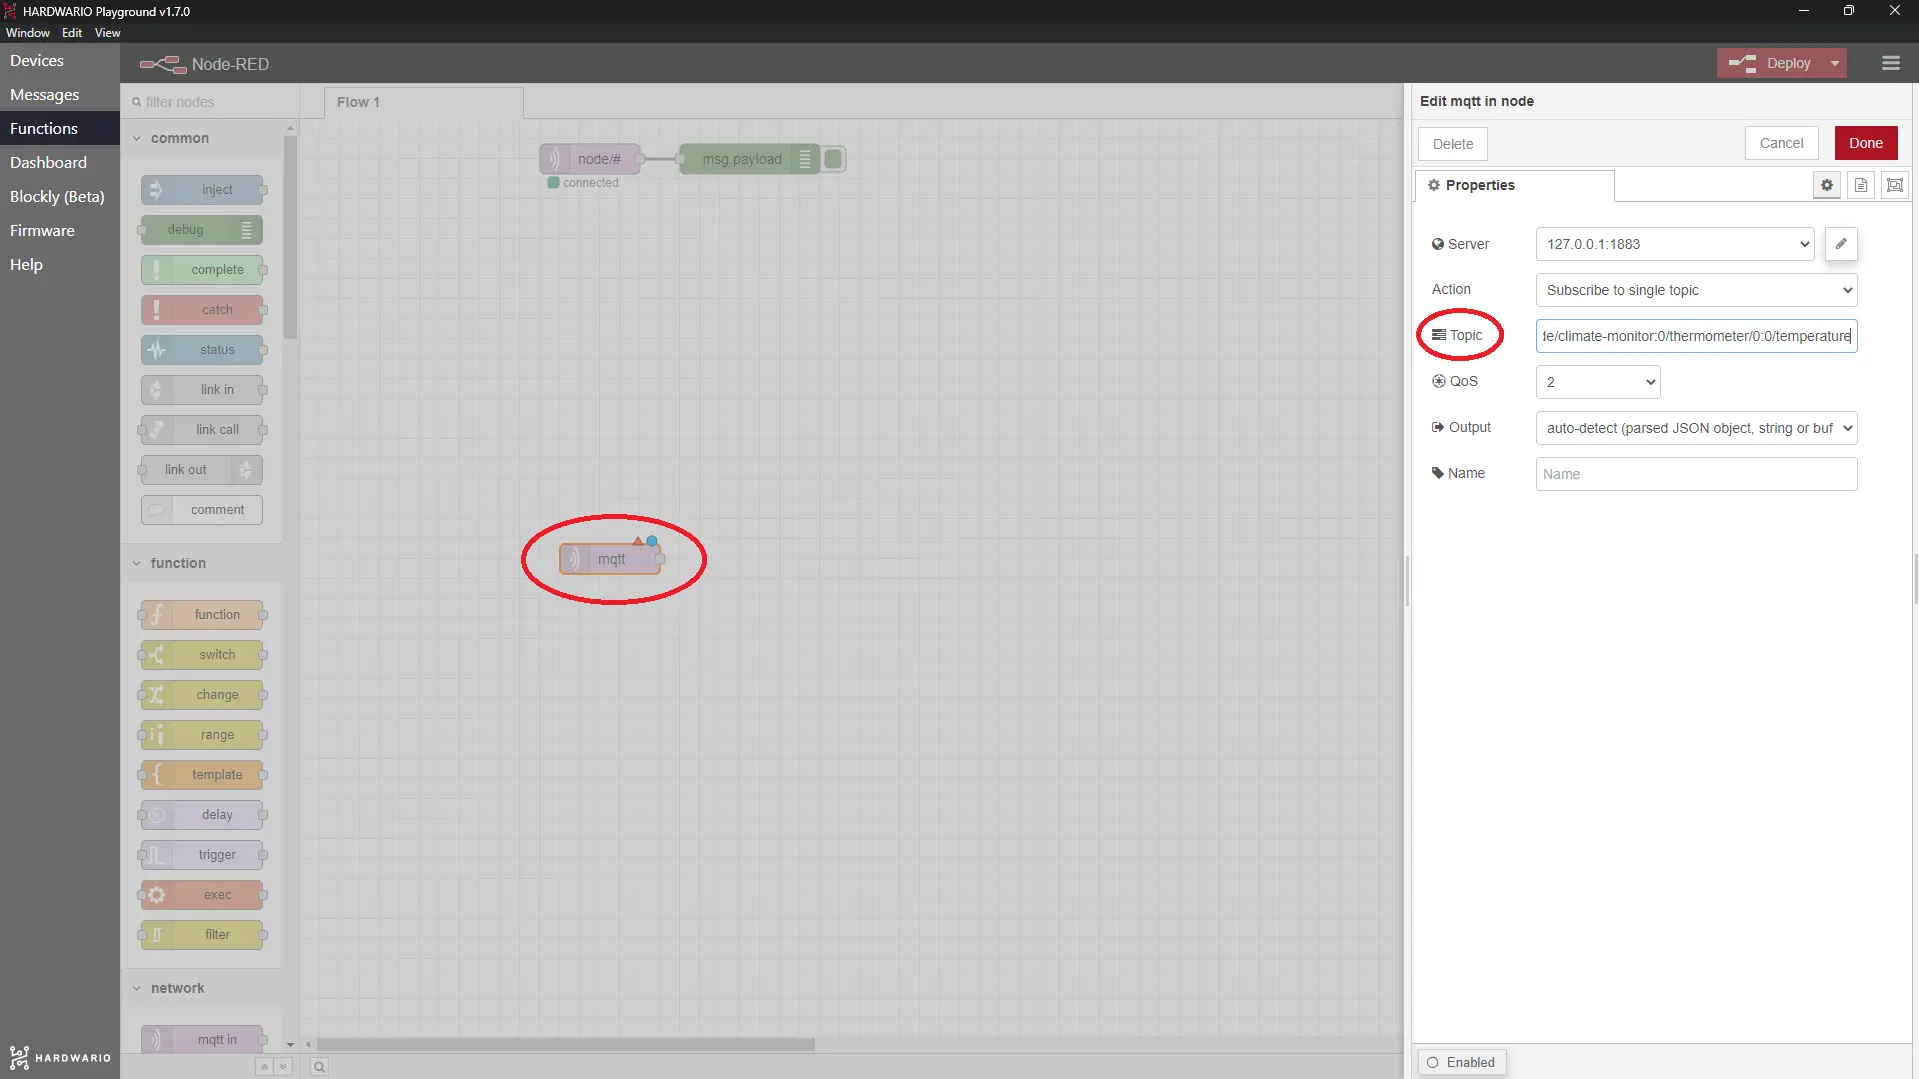
Drag a light purple mqtt in node (a bubble) onto the empty canvas. You'll find it in the network section.
-
Double-click the node to open it. In the Topic field you choose what the colored gauge will show. This time it's temperature, so copy the temperature message from the Messages tab (without the number) into the field. Or simply use this one:
node/climate-monitor:0/thermometer/0:0/temperature
Confirm with Done.
-
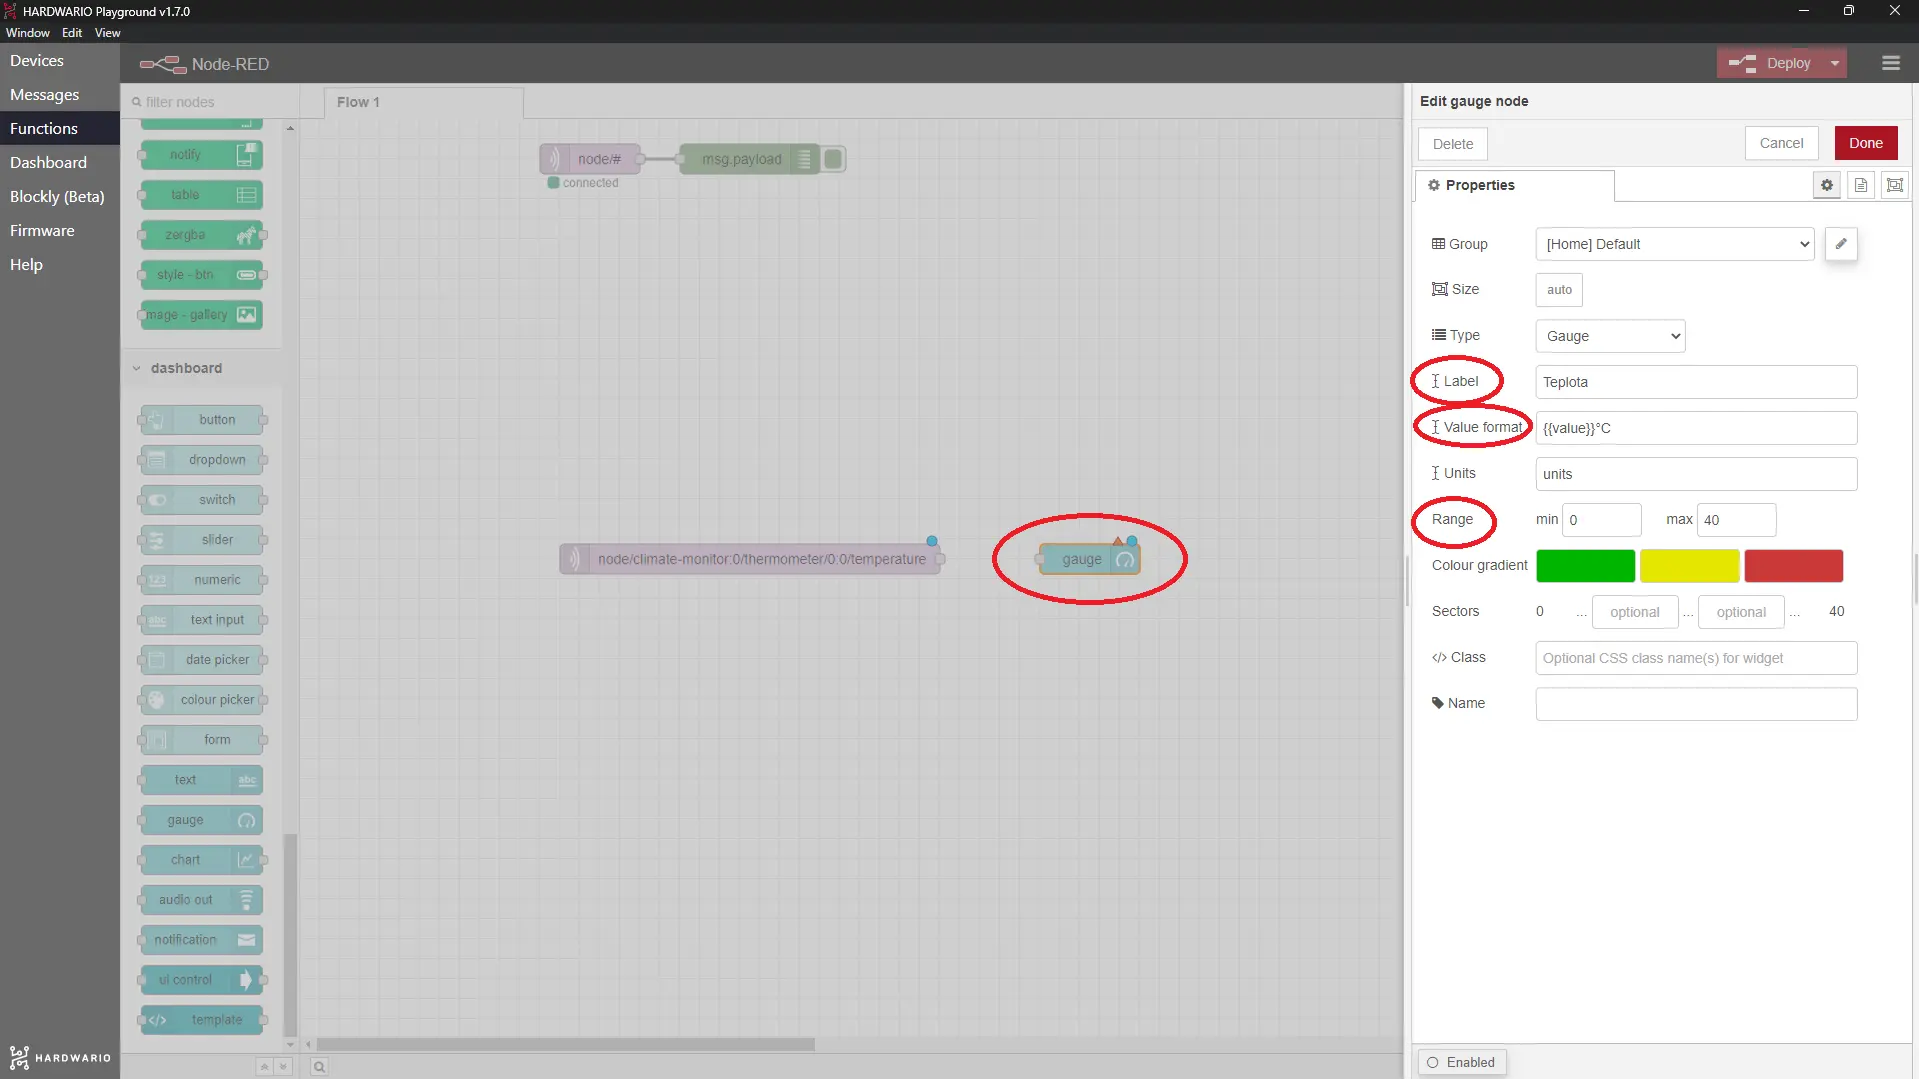
Next to it, place a second, light blue node called Gauge. You'll find it in the Dashboard section. This node decides how the measured temperature appears on the screen.
-
Double-click the Gauge node. In the Range field, set the temperature range the gauge will show. 0 to 40 °C is enough. In the Label field, give the gauge any name you like, and add the temperature unit, °C, in the Value format field. If you like, also pick a color for the gauge in the Colour gradient field.
Confirm with Done.
-
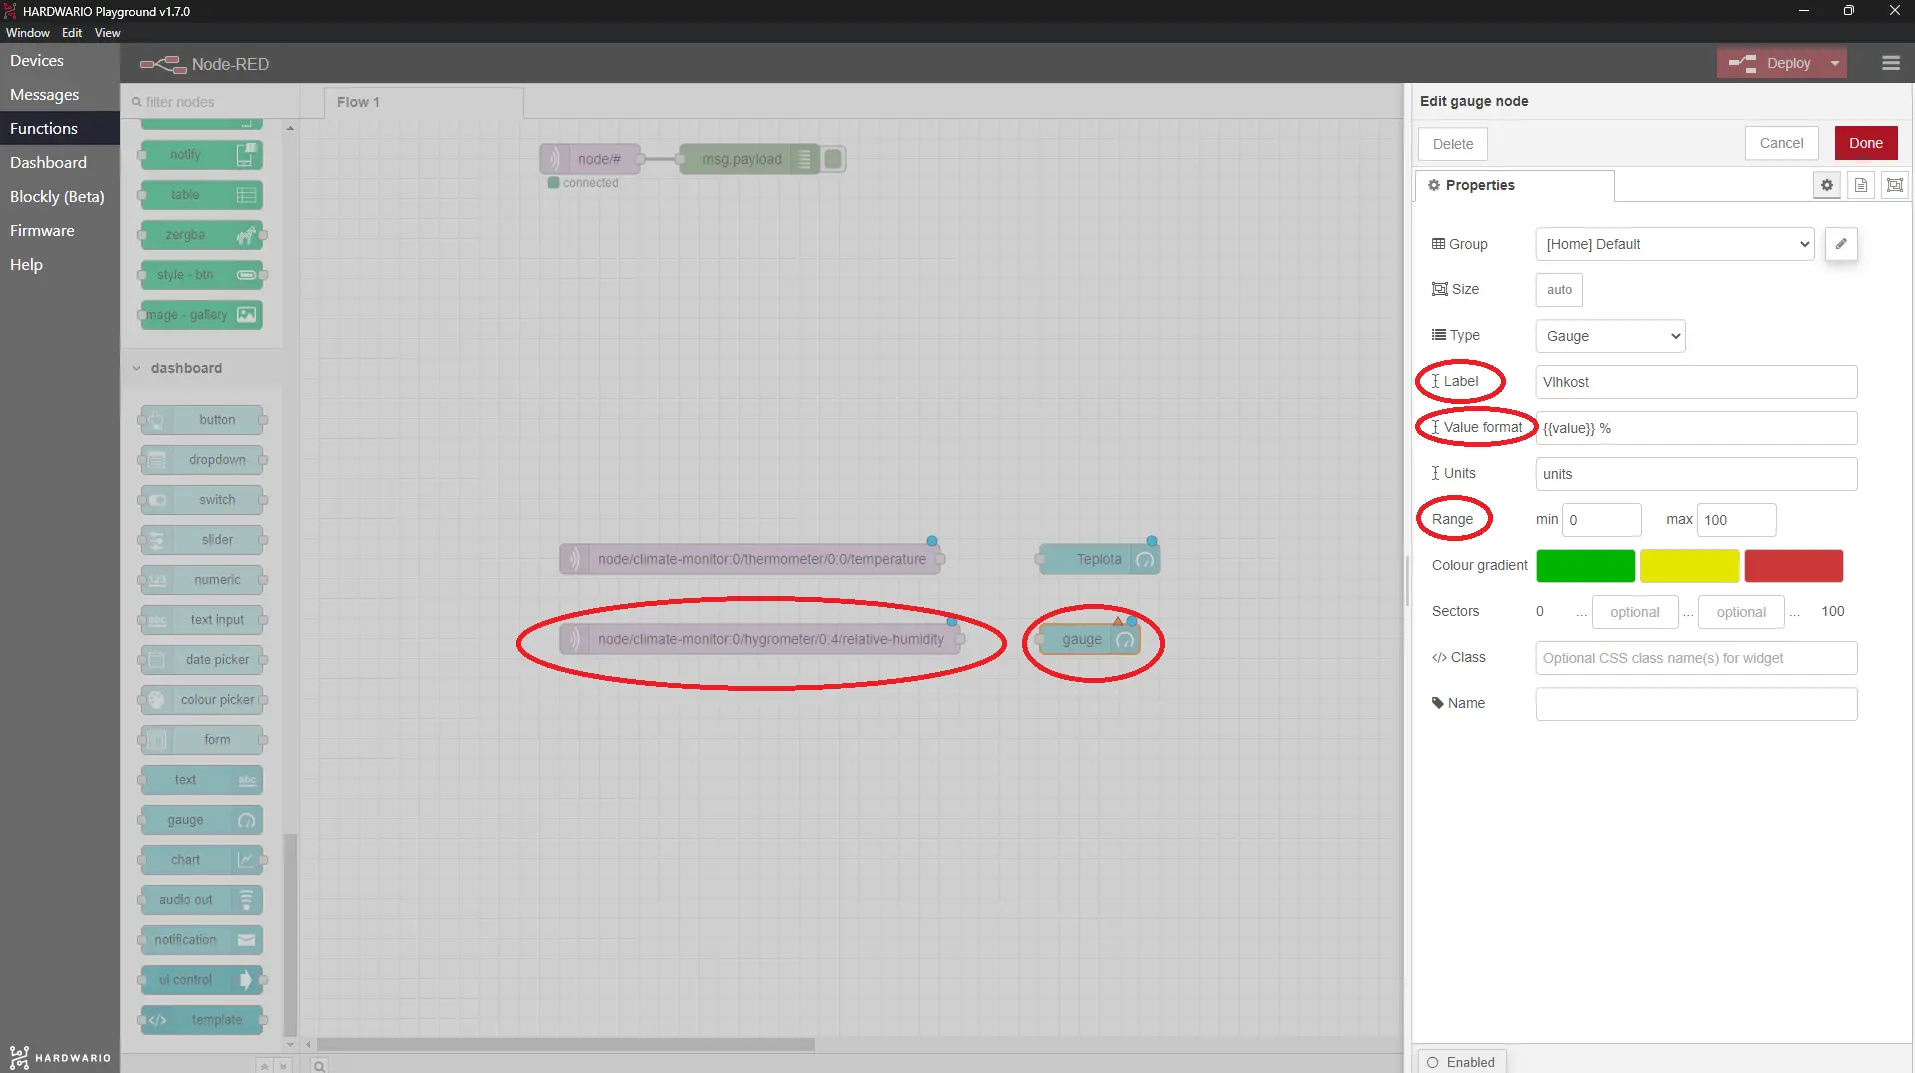
Temperature is done, so move on to the other values. Below the temperature nodes, add two more of the same nodes: MQTT and Gauge.
-
This time, copy the humidity topic into the MQTT node. It looks like this: node/climate-monitor:0/hygrometer/0:4/relative-humidity. In the new Gauge node, set Range to 0 to 100 and enter % in Value format (humidity is measured in percent). Don't forget to name the gauge, and give it a color if you like.
-
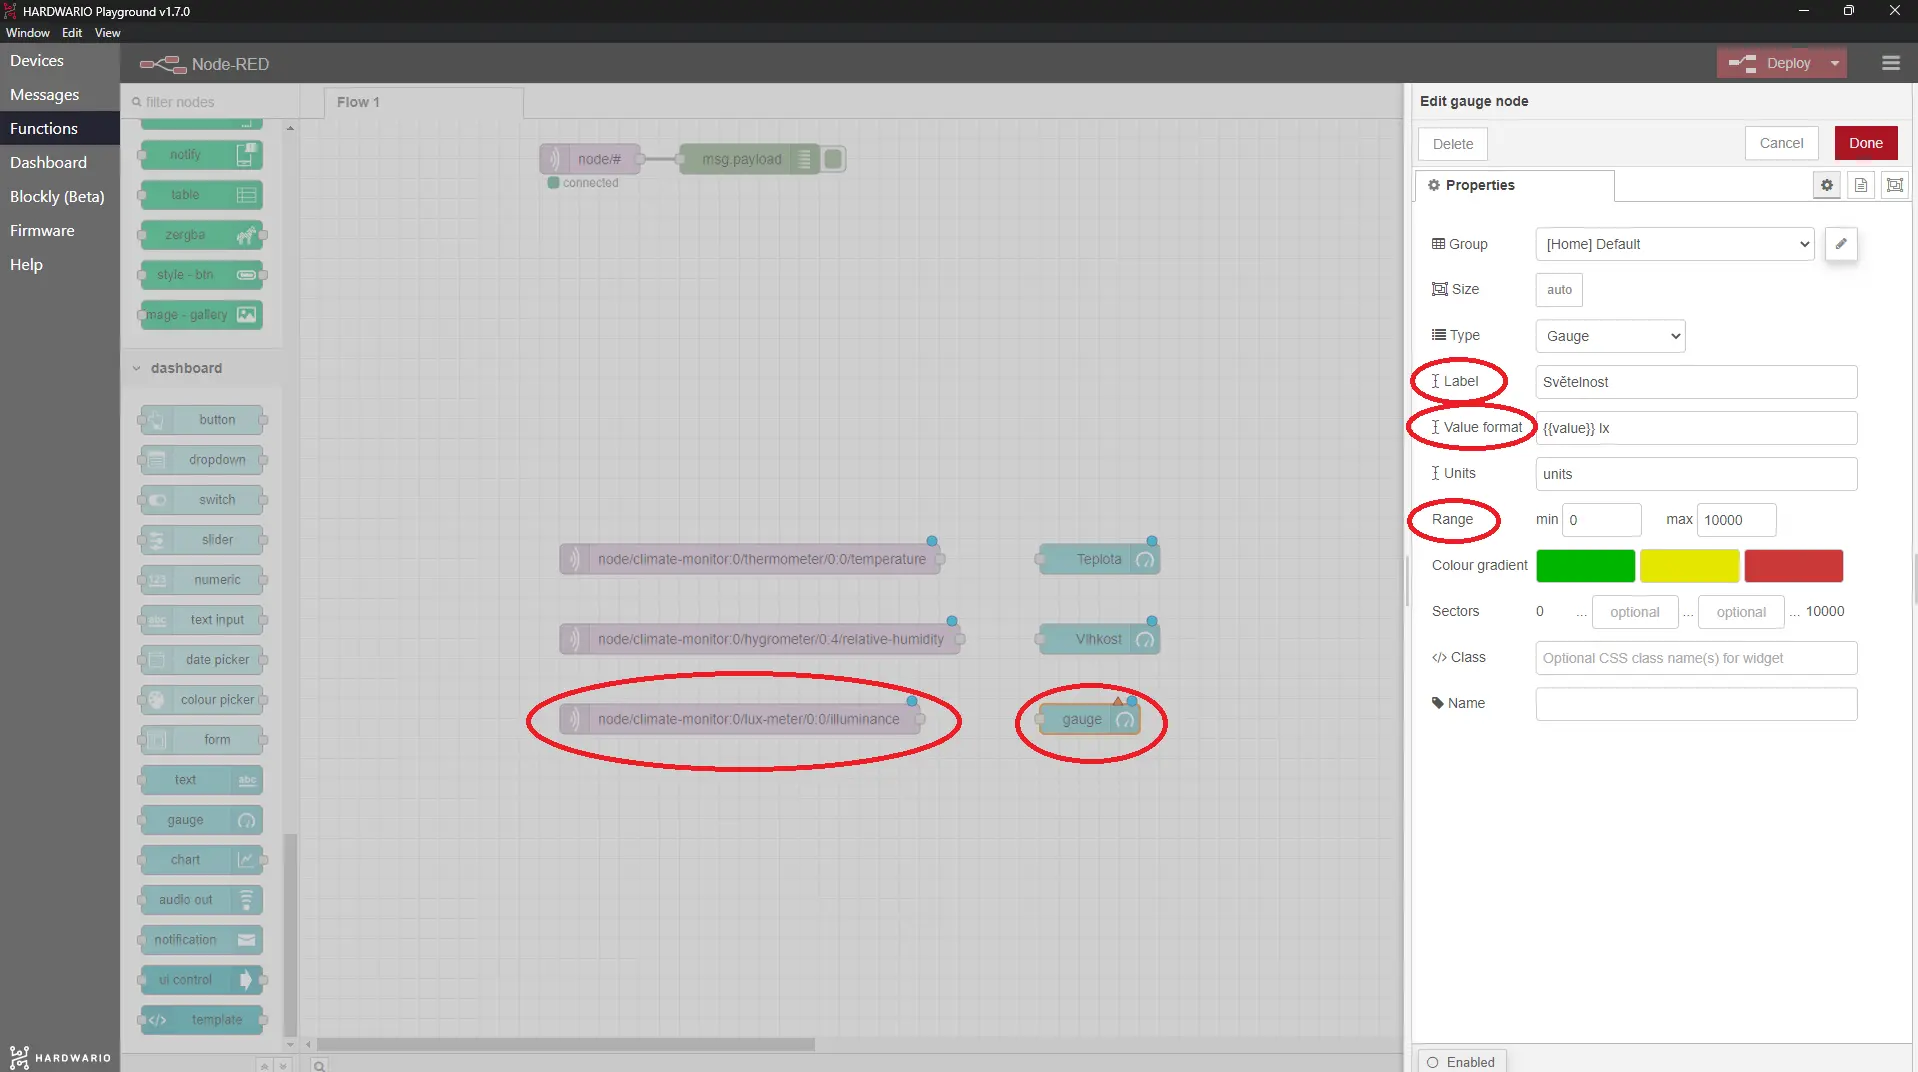
Next up is the illuminance gauge. 💡 The steps are exactly the same: one MQTT node and one Gauge node.
-
Copy this topic into the MQTT node: node/climate-monitor:0/lux-meter/0:0/illuminance. In the Gauge node, set the range to 0 to 10,000 this time and enter the illuminance unit, lx (lux), in Value format. Again, pick a name and a color if you like.
-
Three values down, one to go: air pressure. Add one more MQTT node and one more Gauge node.
-
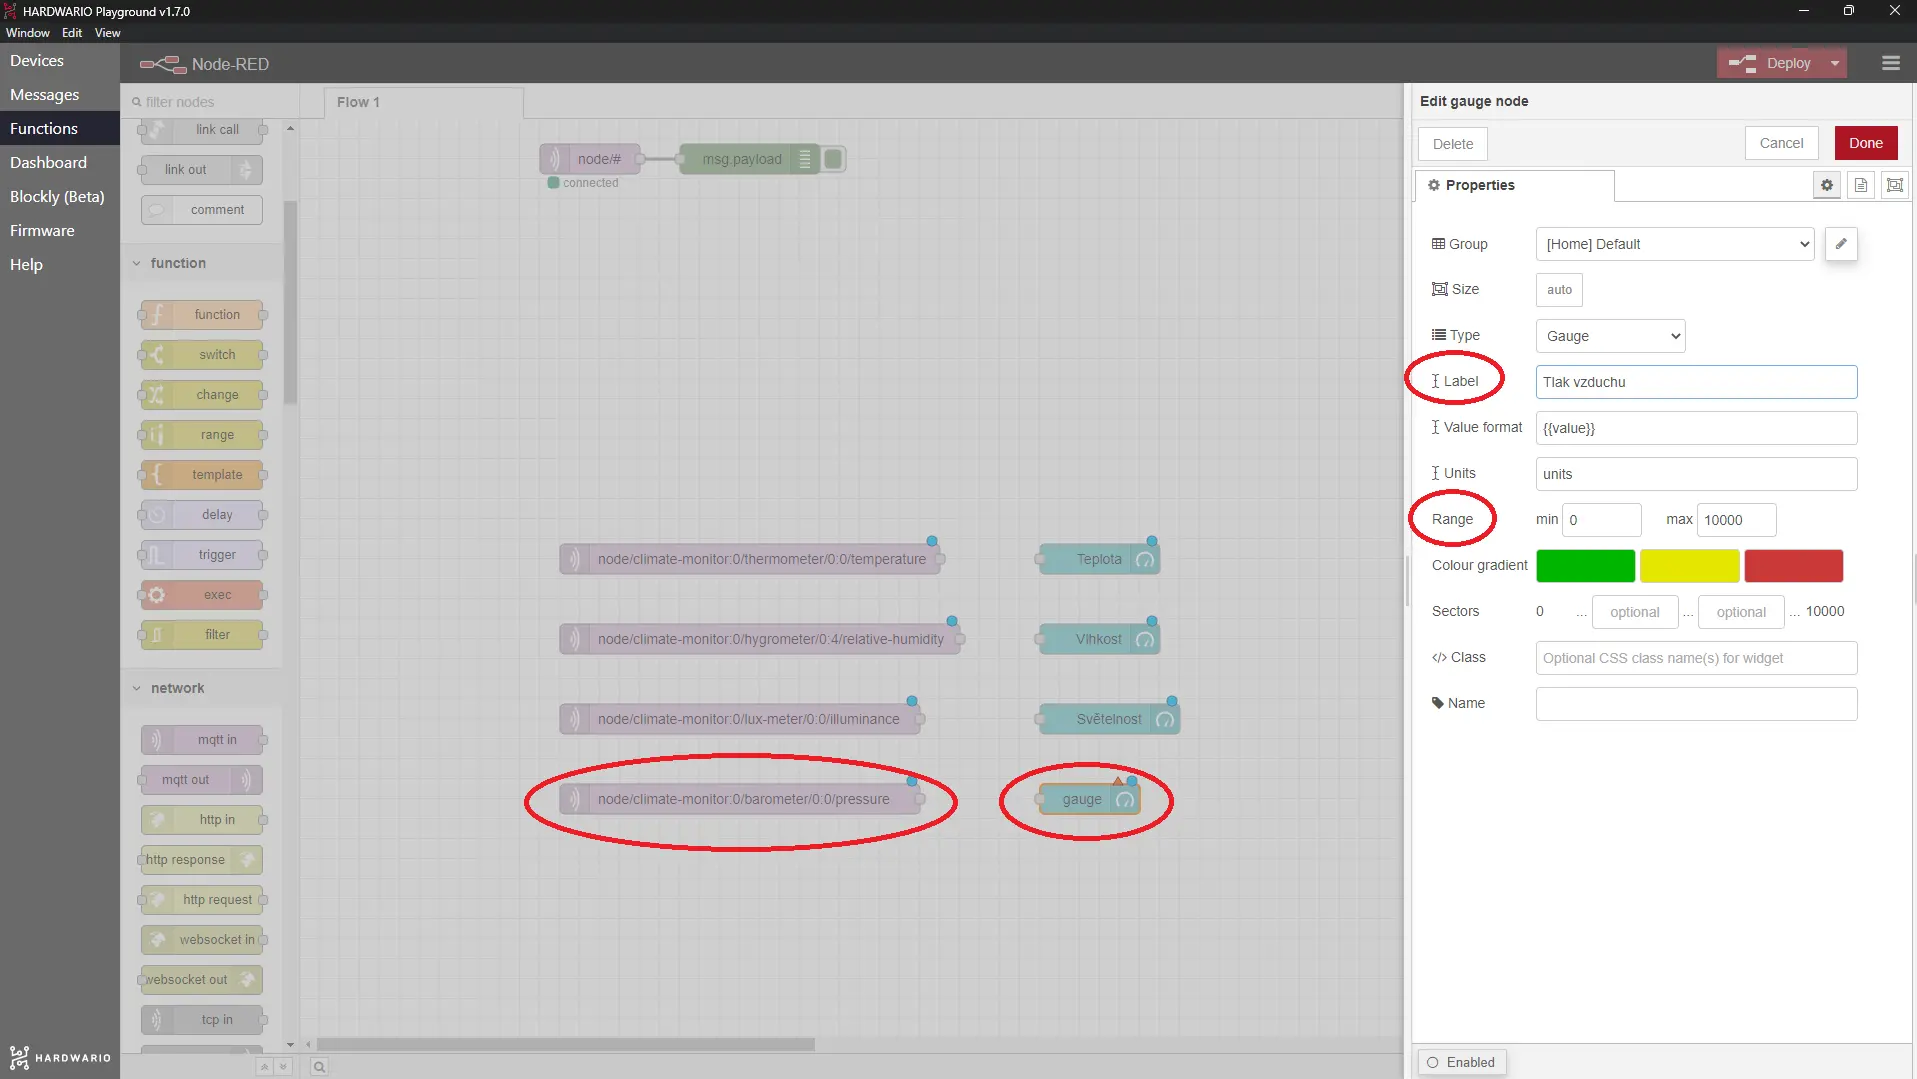
Copy the Topic for air pressure into the MQTT node:
node/climate-monitor:0/barometer/0:0/pressure
In the new Gauge node, set the range to 80,000 to 110,000. The sensor sends air pressure in pascals, and near the ground it is around 100,000 Pa. You don't need to set the unit this time, but feel free to add a name and a color.
- To see more than just the current numbers, add charts for three of the values. They show at a glance how humidity, illuminance and air pressure changed over the last hour. 📈
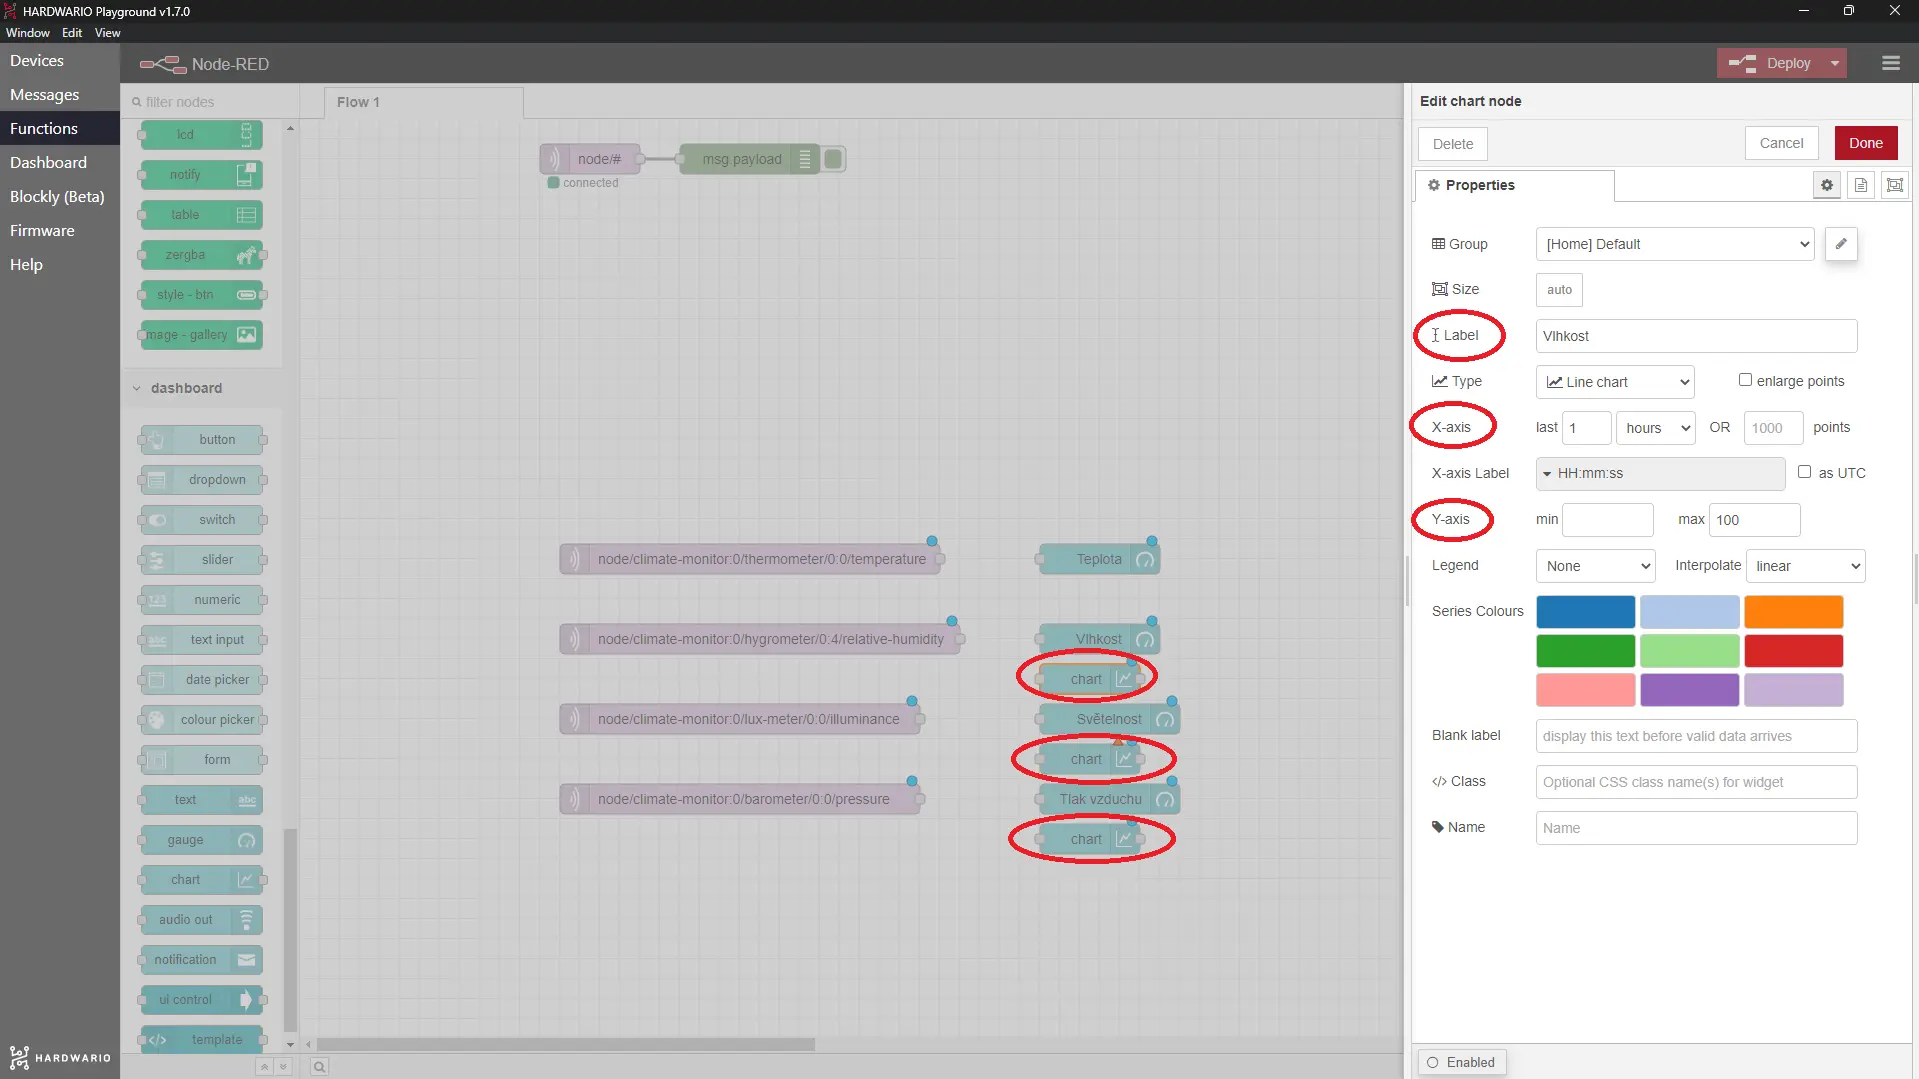
Below the Gauge nodes for humidity, illuminance and pressure, add one Chart node each from the Dashboard section.
- Open the three nodes one by one and give each the same Label as the Gauge node next to it. In X-axis, set the period you want to see the results for (one hour should already be set).
In Y-axis, enter the same ranges as in the neighboring Gauge nodes: 0 to 100 for humidity, 0 to 10,000 for illuminance and 80,000 to 110,000 for pressure.
Done! Before you start measuring, add one more neat feature: a virtual guard.
Add the ideal temperature indicator
The virtual guard tells you whenever your reptile's terrarium is not at the right temperature. 🐍 You'll build it from several nodes.
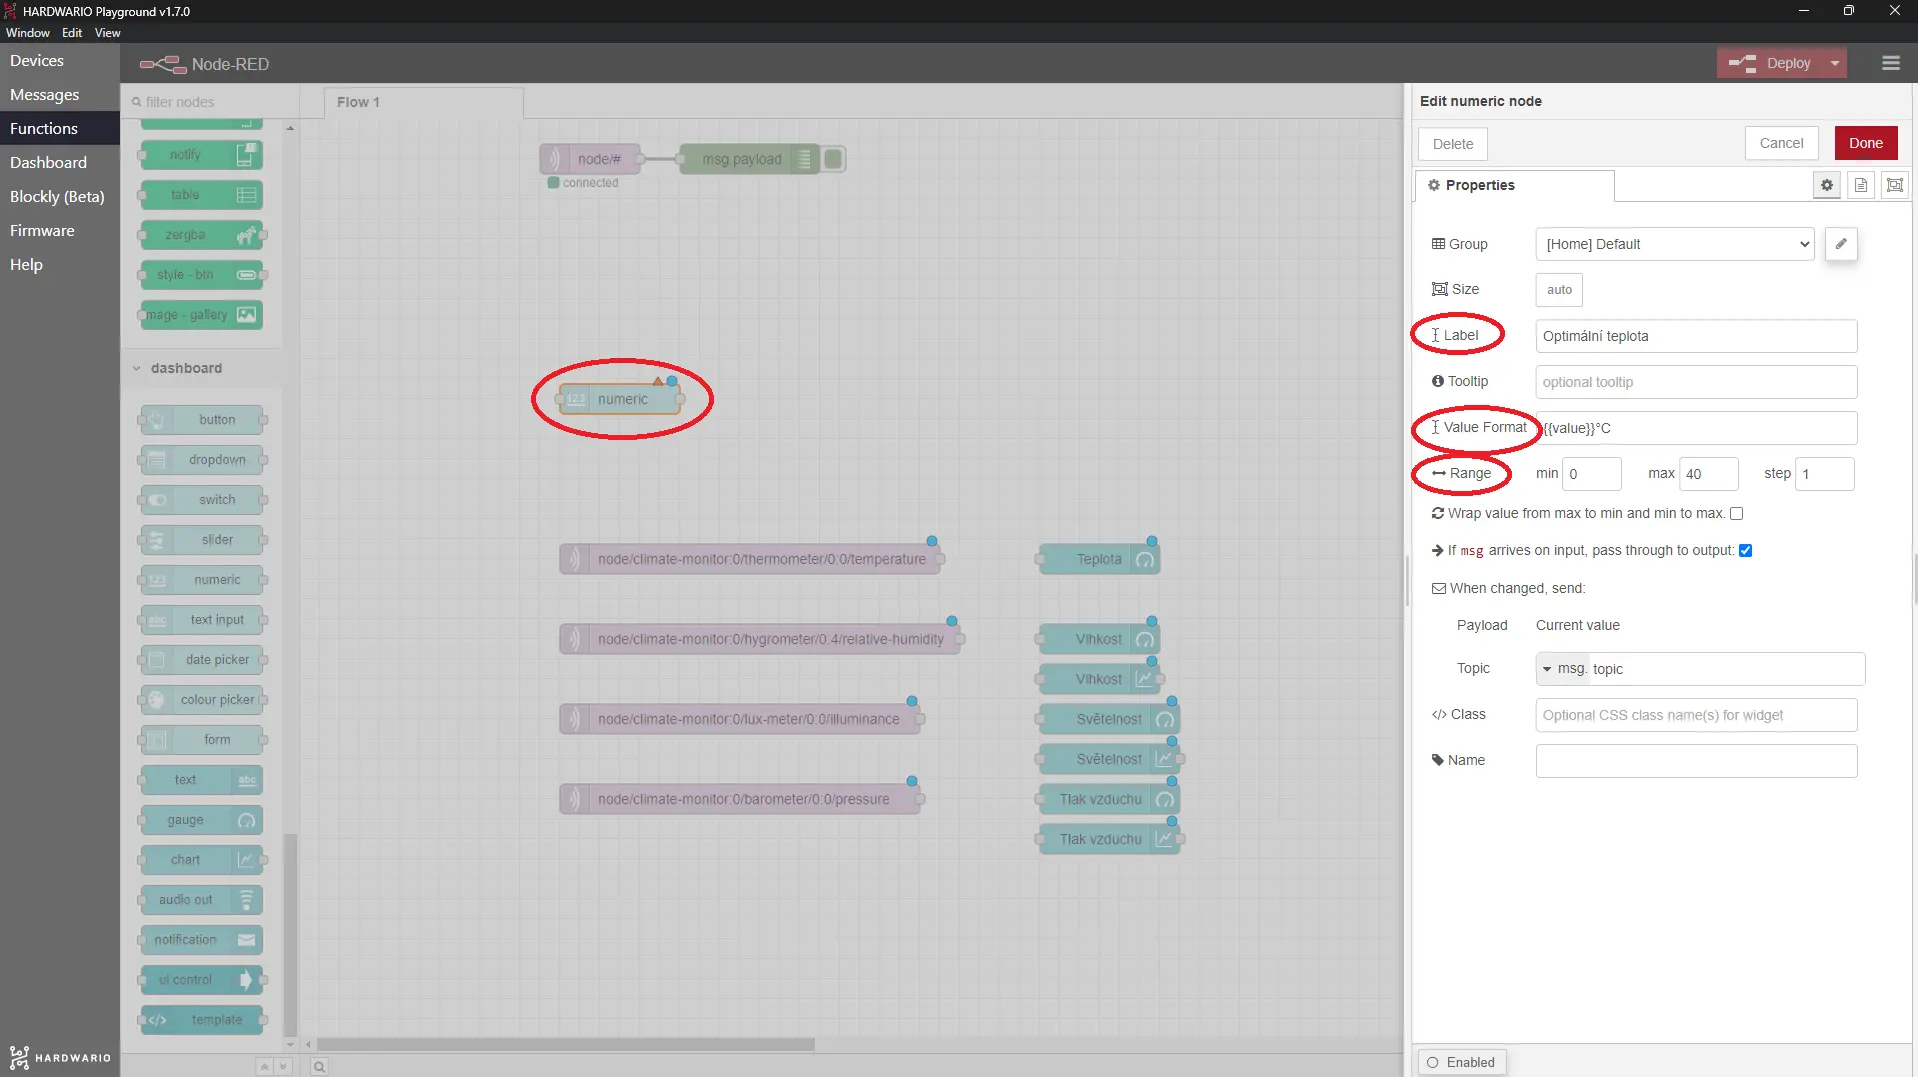
- Above everything you've built so far, add a Numeric node from the Dashboard section. You'll recognize it by the 123 on it. Open it and fill in Range and Value format exactly as for the first Gauge node. If you don't remember them, check the screenshot below. Don't forget to name the node in the Label field, for example Ideal temperature.
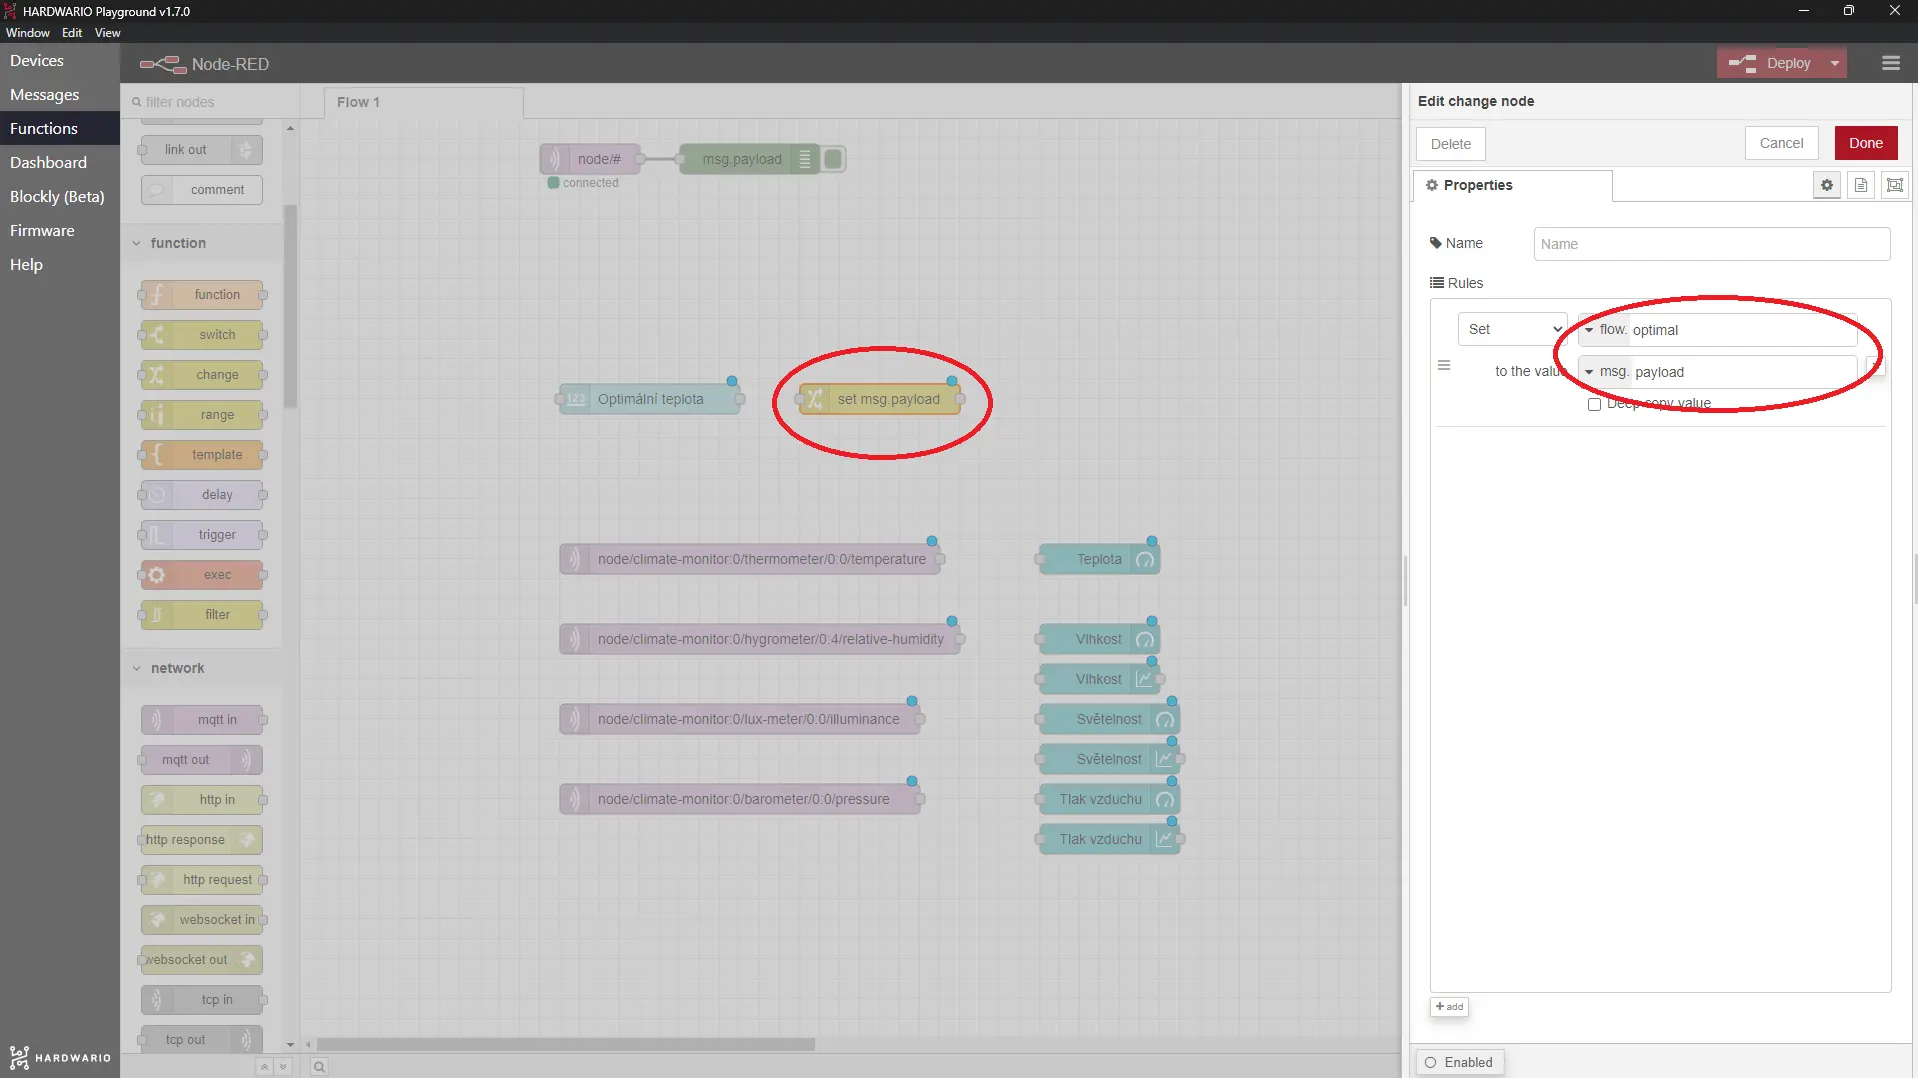
- Right next to it, add another node, a new one this time: a Change node from the Function section. Open it and set flow.optimal and msg.payload in it, one below the other (as in the screenshot). What this is for: These two nodes (Numeric and Change) set the ideal temperature, and the guard warns you when the measured temperature is off. 👮 You'll set the optimal temperature with the Numeric node on the Dashboard, and the Change node stores it in the flow.optimal variable. The nodes you add next work with that variable.
- Now it's time for a Switch node, which is also in the Function section. Drag it next to the MQTT node for temperature and open it.
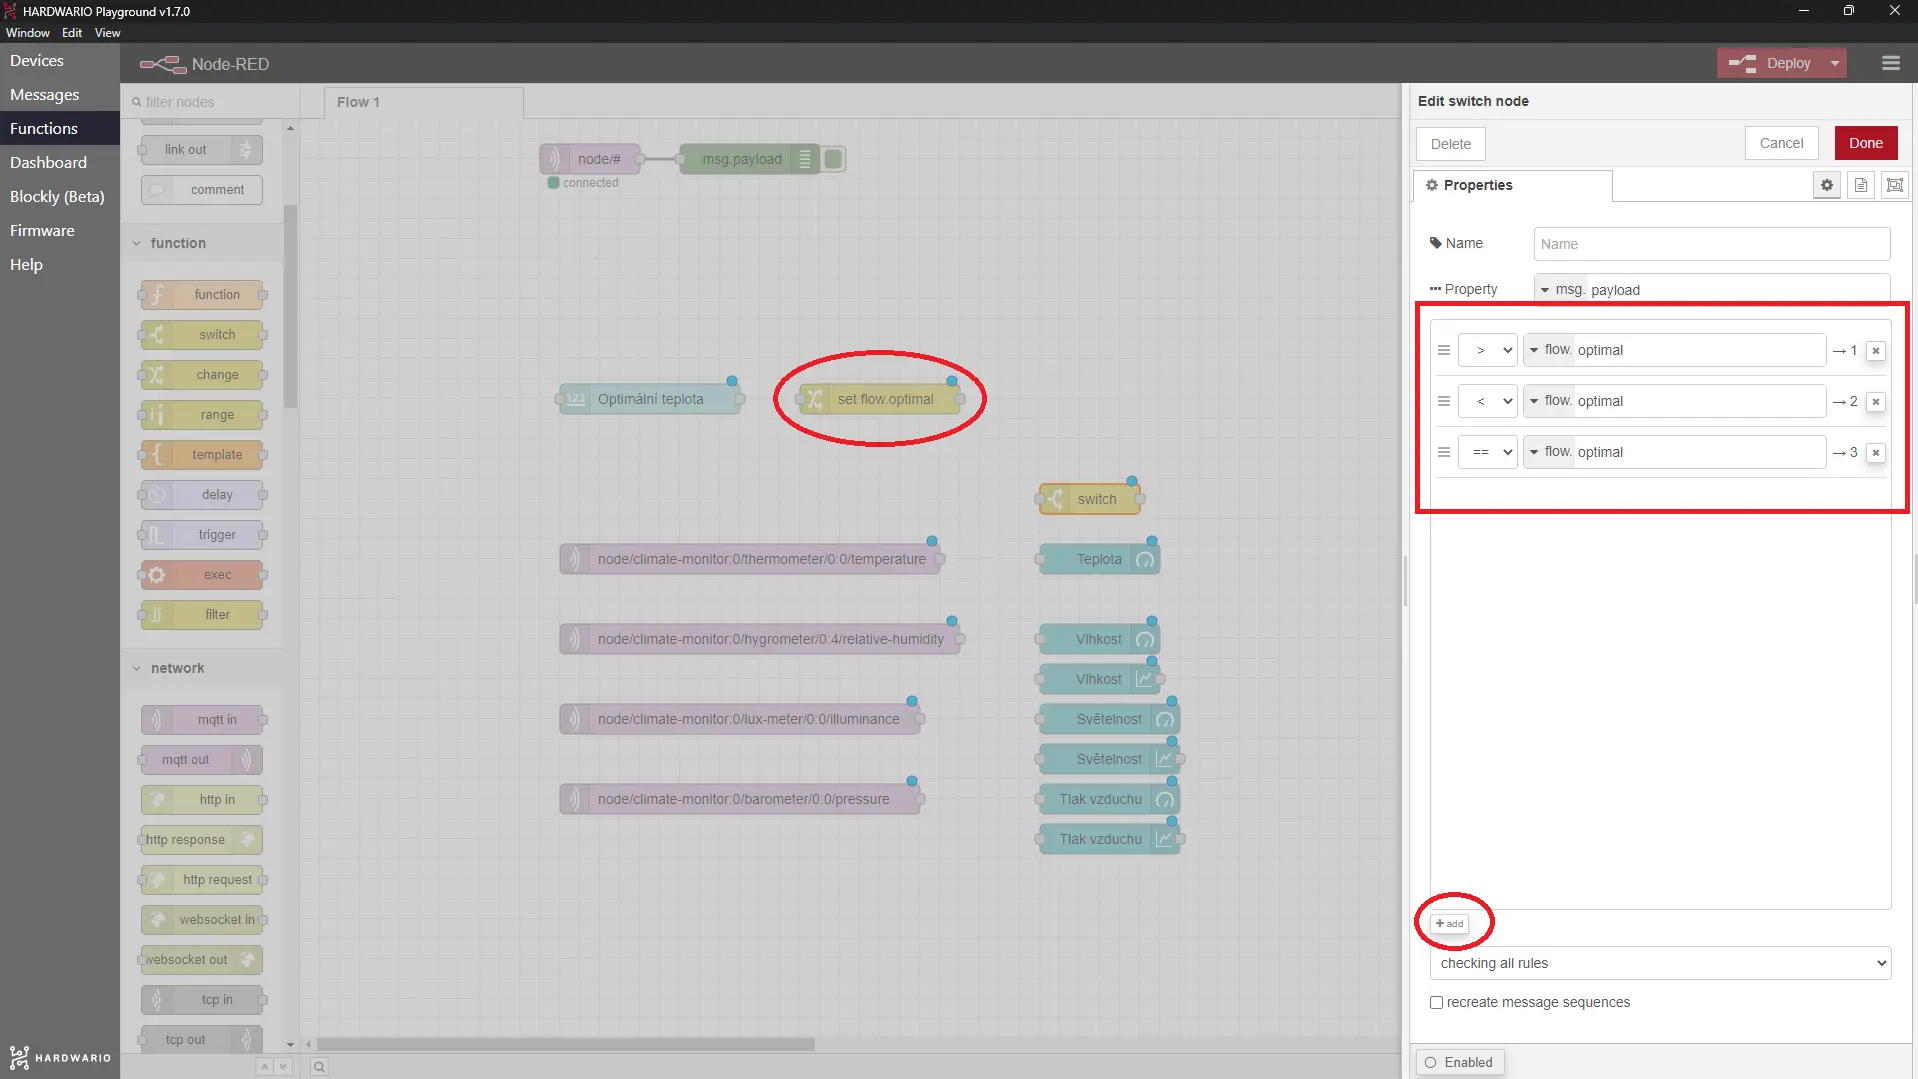
In it, you'll set up three situations that can happen while you watch the ideal temperature: the temperature is just right, too low or too high.
- Click the small +add button twice so the node has three situations. Then set them up exactly as in the screenshot below. Notice that every line contains “flow.optimal”. The program always checks the current value of this variable and uses it to tell which situation it is.
-
Now set up the messages that tell you about all three situations. Place three Change nodes one below the other next to the Switch node.
-
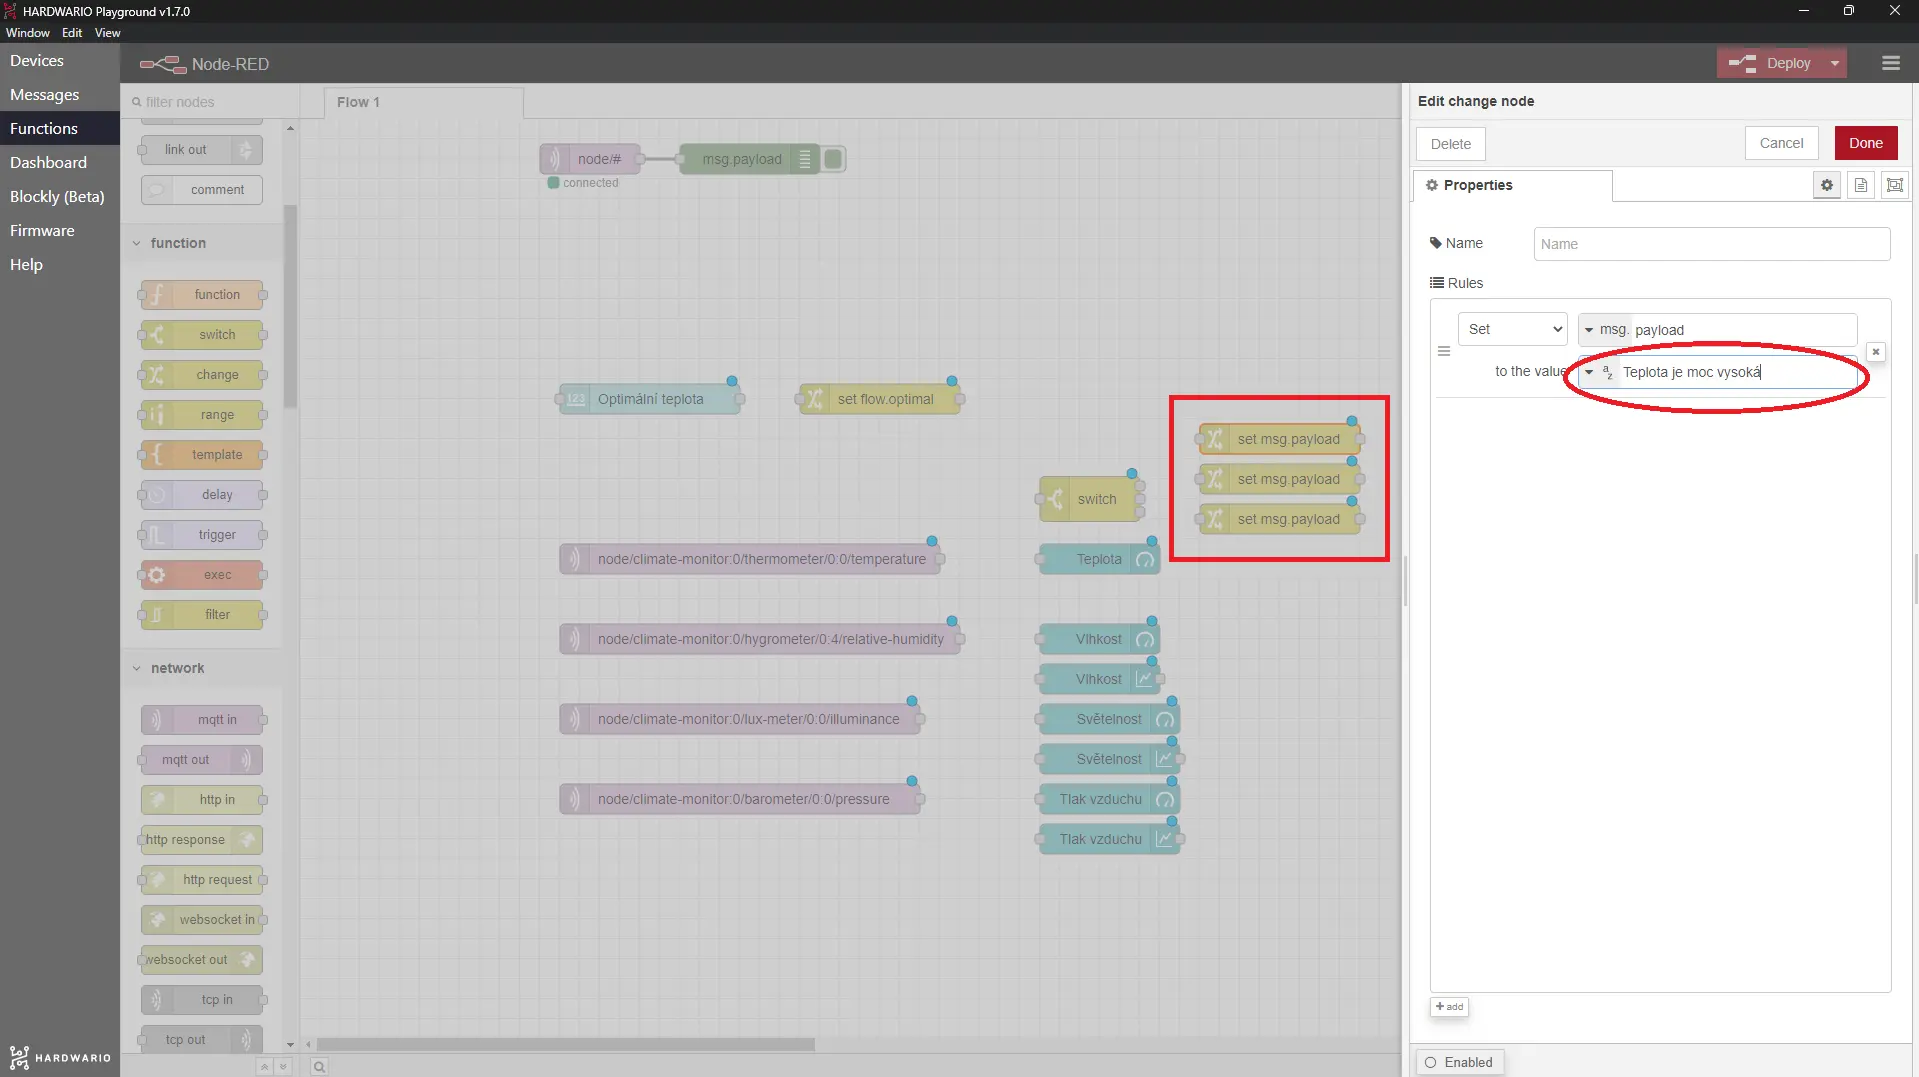
Open the three Change nodes one by one and write a message in each, for example ‘Temperature too high / too low / just right’. If you set up the Switch node exactly as in our screenshot, write the too-high message in the top Change node, the too-low message in the middle one and the just-right message in the bottom one.
-
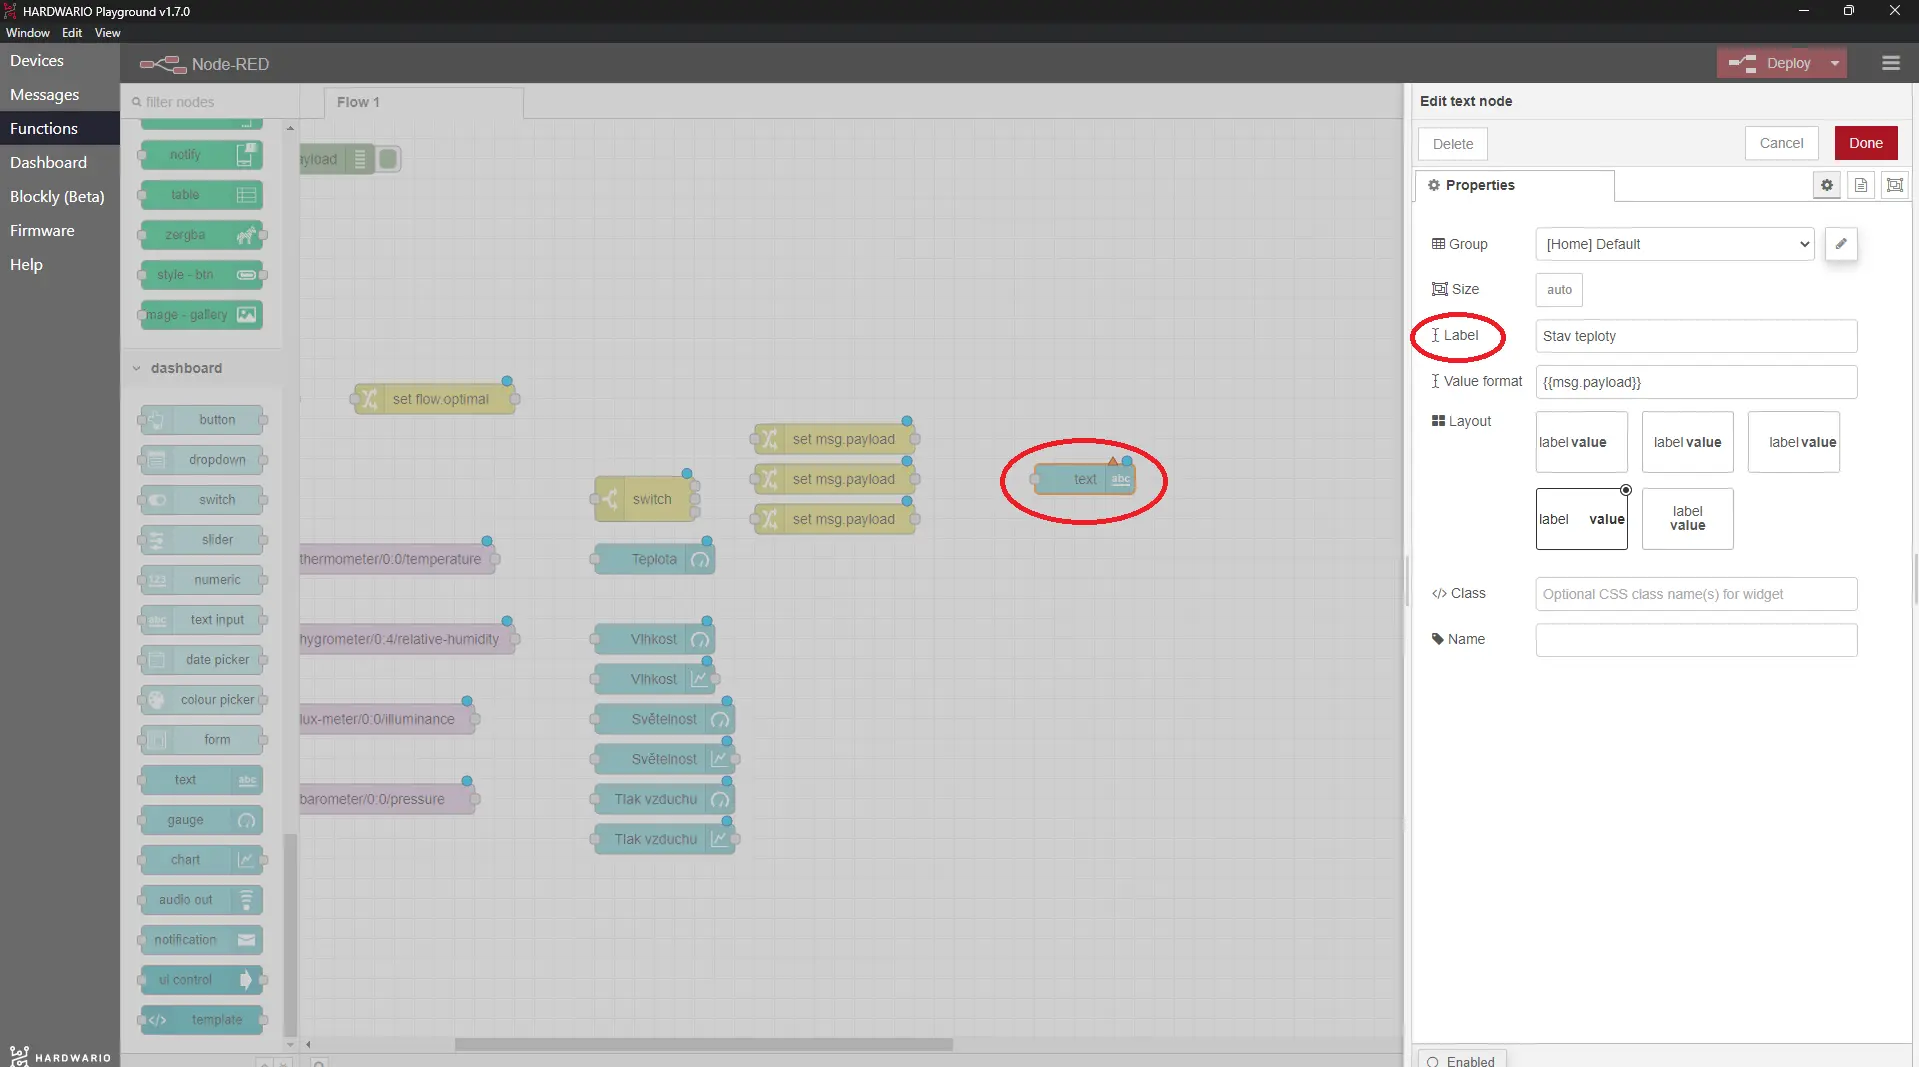
Just one more node and you can start it all up! 🏎️ After the three Change nodes, add a Text node from the Dashboard section. It shows the messages you set up in the previous step.
-
Open the node and name it in the Label field, for example Temperature status.
- Done! Now wire up the whole flow as in our screenshot. If you feel up to it, wire it yourself and then just check it against the screenshot. 💪
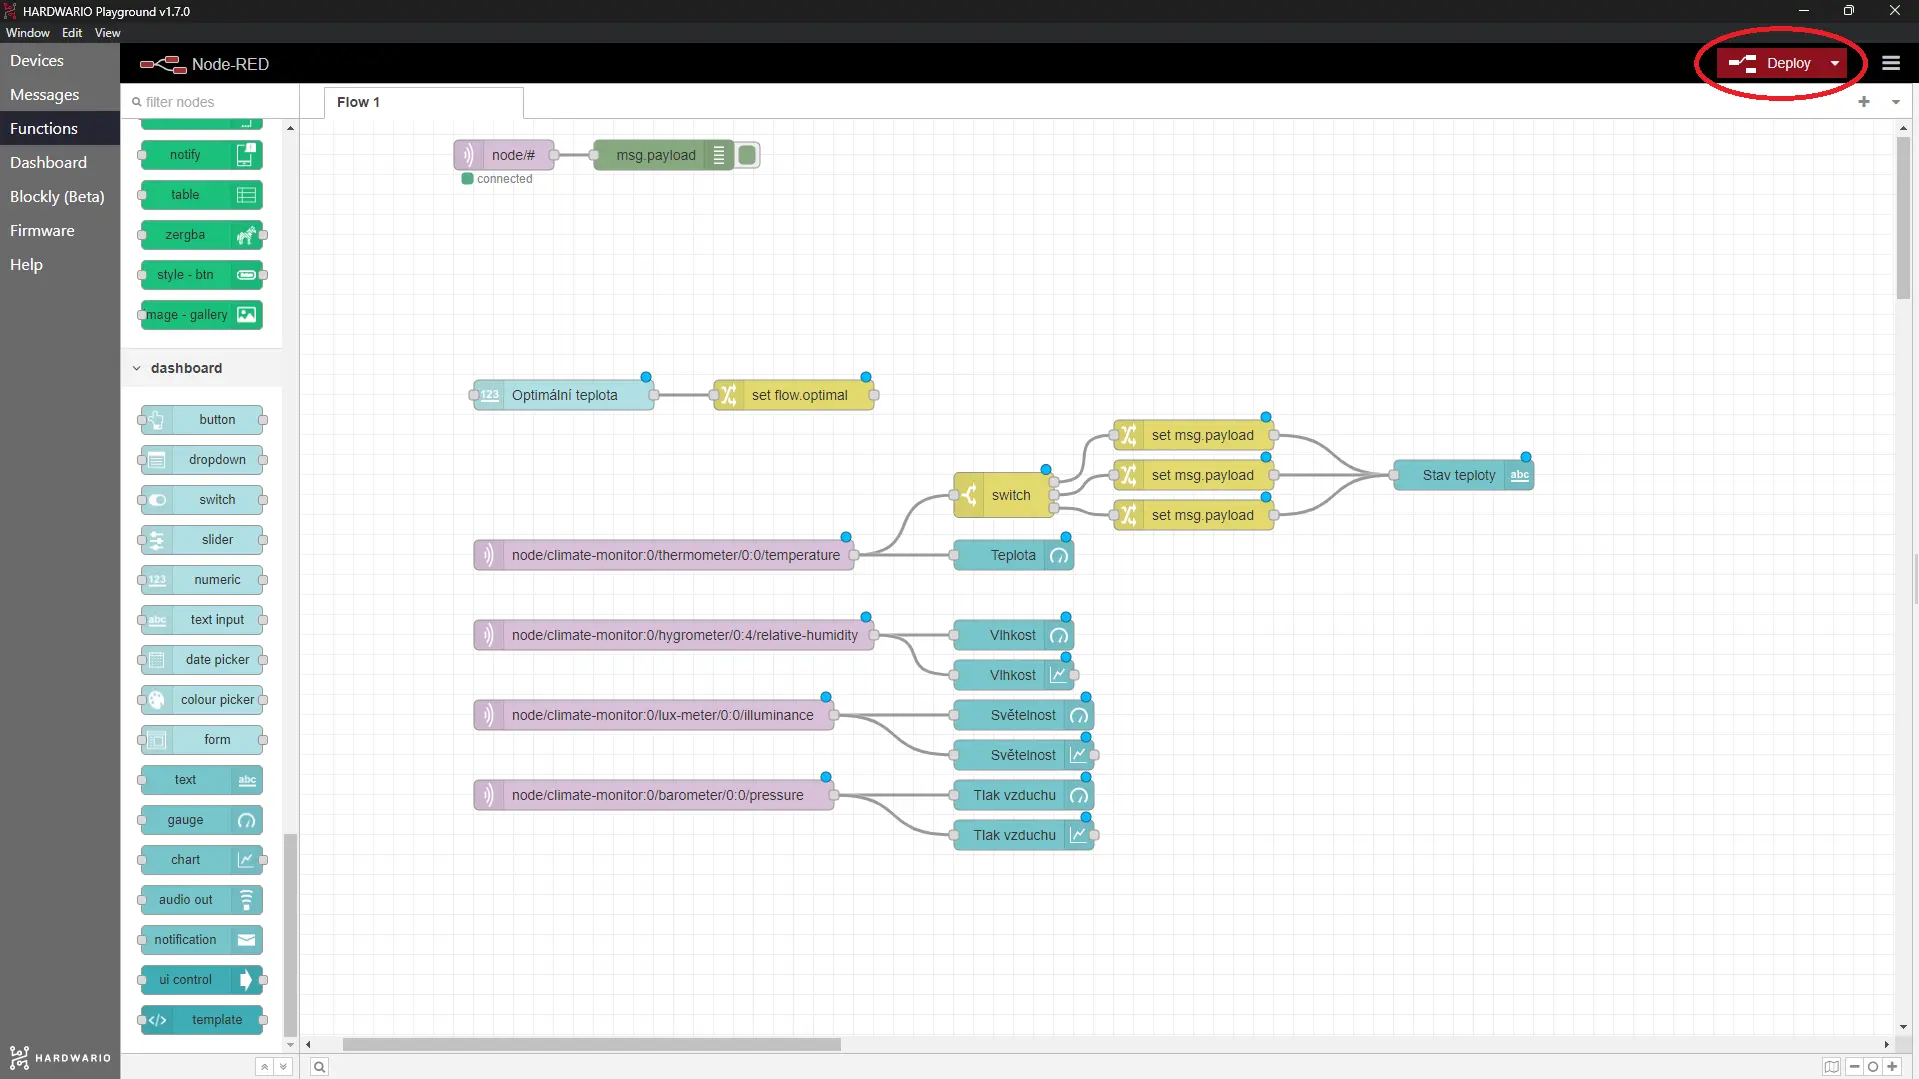
- Click the Deploy button in the top right to start this whole big flow. The Dashboard will show your measurements roughly like this:

Ready, steady, go!
-
Tape the box firmly inside the terrarium of your scaly little brother or sister. 🏡
-
On the Dashboard, find the optimal temperature setting and use the two arrows to choose the temperature your iguana, snake or turtle needs. Look up the ideal value for your pet online.

- Check that your pet has the ideal temperature, and watch how pressure, illuminance and humidity rise and fall.
- If the measured temperature is far off the ideal one, ask for advice at a pet store or your vet, so your reptile stays perfectly happy. 👌