Node-RED and the Start set
Introduction
Node-RED is a simple yet powerful tool, and now we will show how to create a basic dashboard to display information about the number of button presses, temperature, and tilt status.
How many times have I pressed the button?
To display the button press count, we first need to retrieve that value.
- If you haven't already, start HARDWARIO Playground. From the previous tutorial, we know that data appears in Messages, and if you click on the line with the topic
node/motion-detector:0/push-button/-/event-count, it gets copied to the clipboard, which is confirmed by a pop-up info panel.
If you have multiple Push Button modules paired, they will differ by the number after `motion-detector:`
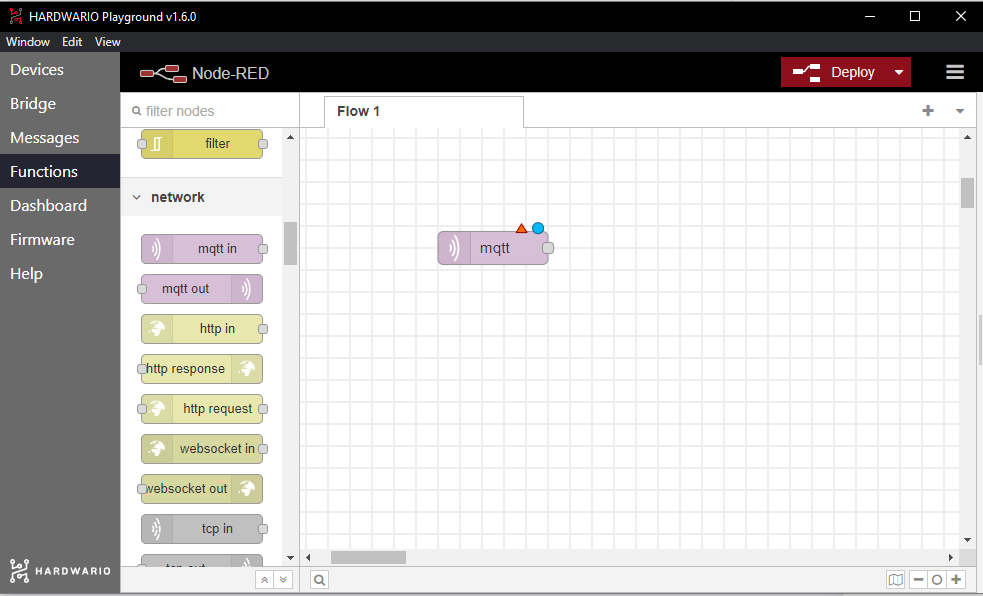
- Now go to Functions. This is the embedded Node-RED application. It has excellent documentation, support, and a large user community. It works on the principle of visual programming – you add functional blocks (called nodes) to the canvas and by connecting them, you create a functional application (flow).
- Delete the two nodes that are already on the canvas.
- Start by adding an mqtt in node. You can find it in the network section on the left. Drag it onto the canvas.

- Double-click it to open its settings window, where you need to fill in the topic field. This determines which messages we want to receive in this flow.
- Go back to the Messages tab in Playground and find the message with the temperature. Besides the temperature value, you’ll also see the message ID, which looks like this:
node/push-button:0/thermometer/0:1/temperature– this is the topic. - Copy this topic, go back to the Functions section, paste it into the Topic field, and save the settings by clicking Done.
- Now drag a Gauge node onto the canvas – you’ll find it in the dashboard section.
- Double-click it to open its settings. Change the max value in the Range section to 50. Save the settings by clicking Done.
- Connect the two nodes. It’s easy – just click the gray square of one node and drag it to the gray square of the other node.
- Click the Deploy button in the top right to start the application, then switch to the Dashboard tab in Playground.
- Blow on the device to trigger an immediate temperature message – and voilà! You'll see the current temperature in the graph.