Lesson 2 – Measure and plot
🧑💻 Duration: 30 minutes
🎯 Target audience: individuals and small groups
1. Introduction to visual programming
In Playground, you program by dragging and dropping blocks, and the application reacts immediately to the connected modules.
2. Getting started with HARDWARIO Playground
Check that you have everything ready from the previous lesson:
✅ Playground is running
✅ The dongle is connected
✅ The PIR sensor has batteries
✅ In Messages, you can see the outputs of the PIR sensor
3. First program
Create a program that processes the outputs of the PIR Module.
This text does not replace the full Node-RED documentation.
To go deeper, we recommend the official examples.
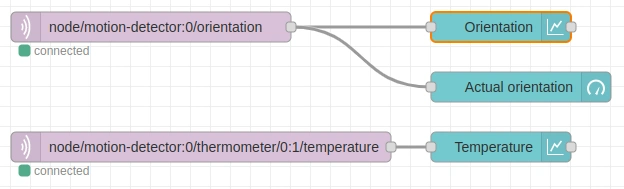
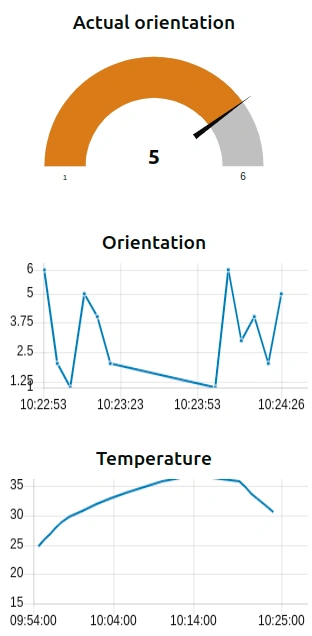
Task: Build an overview dashboard with these elements:
- 🧭 Gauge for the PIR Module orientation
- 📈 Chart of orientation over time
- 🌡️ Chart of temperature over time
👉 Mind the axis labels:
- X-axis: time
- Y-axis: value
4. Example solution
The function that processes data from the PIR Module
The resulting dashboard
5. Summary
✅ You can now connect modules, watch their outputs and display them graphically.
👉 Also try connecting the Climate Module and watching pressure, humidity or illuminance.
In this lesson, you used the orientation and temperature of the PIR Module.
Its motion detection is less suited to quick testing, but you can try it when nothing is moving around you.