Experiment
Experiment 1: Indoor air quality monitor
Time allocation: 15 min.
Experiment Description
We will use the HARDWARIO TOWER kit to build an indoor air quality monitor. It will measure the concentration of carbon dioxide (CO2) and volatile organic compounds (VOC), the temperature and the relative humidity. It will communicate wirelessly with the computer through the Radio Dongle plugged into a USB port. We will display the measured data in the HARDWARIO Playground app, more precisely on the dashboard of the Node-RED environment built into it.
In this experiment, we will learn:
- that warm air rises, and why
- what relative humidity, the dew point and the TH (temperature-humidity) index are
- that the normal outdoor CO2 concentration is 400 ppm, i.e. 0.04%, that it rises in an unventilated room and that higher concentrations reduce our performance
- that CO2 is heavier than air
- that VOCs are volatile organic compounds, that their concentration is measured in ppb and that the acceptable TVOC (total VOC) concentration is 500 ppb (0.00005%)
Experiment Steps
- Building the monitoring unit
- Installing the Playground app
- Connecting the unit to Playground
- Setting up the monitoring functions and data display
- Measuring temperature, humidity, CO2 and VOC
Building the monitoring unit
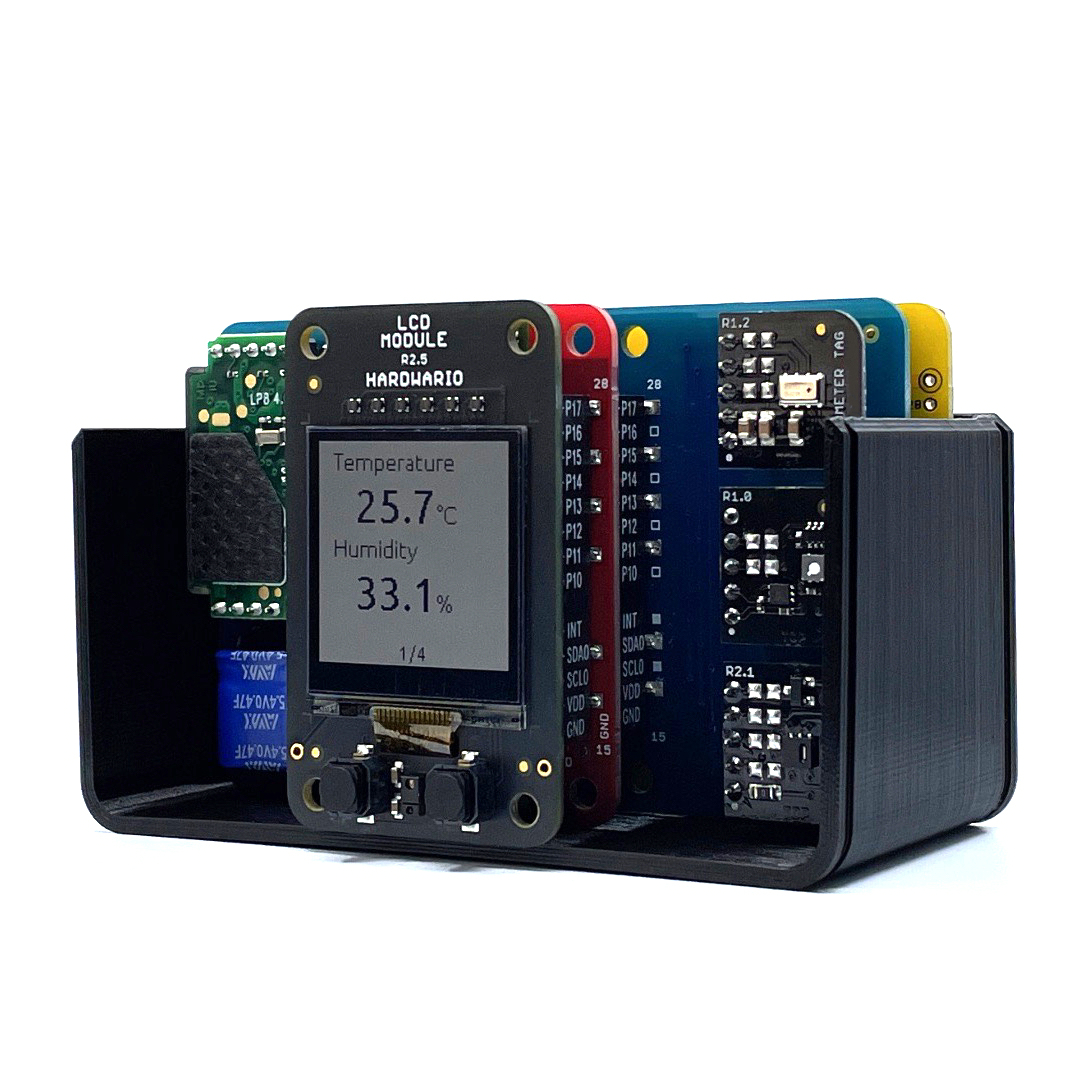
Modules in the setup:
- Core Module
- Battery Module
- CO2 Module
- LCD Module
- Barometer Tag
- Humidity Tag
- VOC-LP Tag
Assemble the unit following the video tutorial.
Installing the Playground app
Download the HARDWARIO Playground app and install it on your computer.
Connecting the Unit to the Playground
- On the Firmware tab, upload the
twr-radio-air-quality-monitorfirmware to the Core Module (guide) - Plug the Radio Dongle into a USB port on the computer
- Open the Playground app and go to the Devices tab
- Select your Radio Dongle from the list of USB devices and click Connect
- Click Start pairing
- Insert the batteries into the unit. Once paired, the unit appears as
air-quality-monitor:0.
Setting up the monitoring functions and data display
- Switch to the Functions tab
- Import this flow:
[{"id":"2c41a2bd.aa36ae","type":"tab","label":"IAQ Monitor","disabled":false,"info":""},{"id":"8203aaee.220c58","type":"mqtt in","z":"2c41a2bd.aa36ae","name":"","topic":"node/air-quality-monitor:0/battery/-/voltage","qos":"2","datatype":"auto","broker":"67fc6ccd.e460d4","nl":false,"rap":false,"inputs":0,"x":330,"y":80,"wires":[["c2882634.6eba68"]]},{"id":"302aef24.2e89a","type":"mqtt in","z":"2c41a2bd.aa36ae","name":"","topic":"node/air-quality-monitor:0/co2-meter/-/concentration","qos":"2","datatype":"auto","broker":"67fc6ccd.e460d4","nl":false,"rap":false,"inputs":0,"x":390,"y":180,"wires":[["4d2b292b.1832b8"]]},{"id":"c20126e0.8e7338","type":"mqtt in","z":"2c41a2bd.aa36ae","name":"","topic":"node/air-quality-monitor:0/thermometer/0:1/temperature","qos":"2","datatype":"auto","broker":"67fc6ccd.e460d4","nl":false,"rap":false,"inputs":0,"x":410,"y":280,"wires":[["38569570.b364ca"]]},{"id":"1a91cdd2.5a6892","type":"mqtt in","z":"2c41a2bd.aa36ae","name":"","topic":"node/air-quality-monitor:0/hygrometer/0:4/relative-humidity","qos":"2","datatype":"auto","broker":"67fc6ccd.e460d4","nl":false,"rap":false,"inputs":0,"x":320,"y":360,"wires":[["52201a4f.691954"]]},{"id":"c2882634.6eba68","type":"ui_gauge","z":"2c41a2bd.aa36ae","name":"","group":"57ff470b.93fdf8","order":6,"width":"3","height":"3","gtype":"gage","title":"Voltage","label":"V","format":"{{value}}","min":0,"max":10,"colors":["#00b500","#e6e600","#ca3838"],"seg1":"","seg2":"","x":710,"y":80,"wires":[]},{"id":"4d2b292b.1832b8","type":"ui_gauge","z":"2c41a2bd.aa36ae","name":"","group":"57ff470b.93fdf8","order":1,"width":"3","height":"3","gtype":"gage","title":"CO2 concentration","label":"ppm","format":"{{value}}","min":0,"max":"3000","colors":["#00b500","#e6e600","#ca3838"],"seg1":"","seg2":"","x":710,"y":180,"wires":[]},{"id":"38569570.b364ca","type":"ui_gauge","z":"2c41a2bd.aa36ae","name":"","group":"57ff470b.93fdf8","order":2,"width":"3","height":"3","gtype":"gage","title":"Temperature","label":"°C","format":"{{value}}","min":0,"max":"40","colors":["#00b500","#e6e600","#ca3838"],"seg1":"","seg2":"","x":710,"y":280,"wires":[]},{"id":"52201a4f.691954","type":"ui_gauge","z":"2c41a2bd.aa36ae","name":"","group":"57ff470b.93fdf8","order":3,"width":"3","height":"3","gtype":"gage","title":"Humidity","label":"%","format":"{{value}}","min":0,"max":"100","colors":["#00b500","#e6e600","#ca3838"],"seg1":"","seg2":"","x":720,"y":360,"wires":[]},{"id":"9d36bbee.e2cd08","type":"mqtt in","z":"2c41a2bd.aa36ae","name":"","topic":"node/air-quality-monitor:0/voc-lp-sensor/0:0/tvoc","qos":"2","datatype":"auto","broker":"46ddad92.b27704","nl":false,"rap":false,"inputs":0,"x":360,"y":480,"wires":[["58b50f2f.eedd3"]]},{"id":"58b50f2f.eedd3","type":"ui_gauge","z":"2c41a2bd.aa36ae","name":"","group":"57ff470b.93fdf8","order":0,"width":0,"height":0,"gtype":"gage","title":"TVOC","label":"units","format":"{{value}} ppb","min":0,"max":"200","colors":["#00b500","#e6e600","#ca3838"],"seg1":"","seg2":"","x":710,"y":480,"wires":[]},{"id":"67fc6ccd.e460d4","type":"mqtt-broker","broker":"127.0.0.1","port":"1883","clientid":"","usetls":false,"compatmode":true,"keepalive":"60","cleansession":true,"birthTopic":"","birthQos":"0","birthPayload":"","willTopic":"","willQos":"0","willPayload":""},{"id":"57ff470b.93fdf8","type":"ui_group","name":"Default","tab":"11207769.c31889","order":1,"disp":true,"width":"6","collapse":false},{"id":"46ddad92.b27704","type":"mqtt-broker","name":"","broker":"127.0.0.1","port":"1883","clientid":"","usetls":false,"compatmode":true,"keepalive":"60","cleansession":true,"birthTopic":"","birthQos":"0","birthPayload":"","closeTopic":"","closeQos":"0","closePayload":"","willTopic":"","willQos":"0","willPayload":""},{"id":"11207769.c31889","type":"ui_tab","name":"Home","icon":"dashboard"}]
- Click Deploy to apply the changes
- Switch to the Messages tab. If everything went well, you will see incoming messages from the unit.
- Switch to the Dashboard tab. If everything went well, you will see gauges with the current temperature, humidity, CO2 and VOC readings.
Note:
- To make the unit send data sooner, breathe on it.
- The unit measures the temperature and humidity every 2 seconds, VOC every 5 seconds and CO2 every minute.
- The unit sends the data every 15 minutes.
- If, since the last transmission, the temperature changes by at least 0.2 °C, the relative humidity by at least 5%, CO2 by at least 50 ppm or TVOC by at least 5 ppb, the unit sends the data immediately.
Measuring temperature, humidity, CO2 and VOC
-
Compete in teams to see who can warm the sensor to the highest temperature with their breath
Question for the team with the lowest temperature
Why does warm air rise? -
Compare the measured humidity between the teams
Question for all teams
The measured humidity is relative humidity. Explain the terms relative humidity and dew point. -
Compare the measured CO2 and VOC concentrations between the teams
Question for all teams
How do you explain the differences in the measured values?
Experiment 2: Connecting the air quality monitor to Google Sheets
Time allocation: 15 min.
Experiment Description
Experiment 1 can be followed by connecting the monitor to Google Sheets. The data measured by the indoor air quality monitor will be saved to a spreadsheet, from which we will then create clear charts.
In this experiment, we will learn:
- how to connect Google Sheets to the Playground app
- how to create clear charts that show how the measured values depend on the class timetable and the number of students in the classroom
Experiment Steps
- Create a Google account
- Create a new Google spreadsheet, for example at sheets.new
- Rename the current sheet from Sheet1 to Data: the code refers to this name
- You can also type column names into the first row. The data arrives in this order: CO₂, Temperature, Humidity, TVOC
- From the Extensions menu, select Apps Script
- Paste this script and save it with Ctrl + S
function doPost(e) {
  var sheet;
  var rawData = e.parameter.val; // Data arrives in format "CO2;temp;hum;TVOC"
  sheet = SpreadsheetApp.getActiveSpreadsheet().getSheetByName("Data");

  var cuttedData = rawData.split(";"); //This cuts arrived data into separated values
  sheet.appendRow([cuttedData[0], cuttedData[1], cuttedData[2], cuttedData[3], new Date()]); //Data arrives in this order: "CO2, Temperature, Humidity, TVOC"
}
- Name the project after your team
- At the top right, click Deploy > New deployment
- Next to Select type, click the settings icon (Enable deployment types) and choose Web app
- Under Execute as, select Me. Under Who has access, select the option that lets anyone use the app without signing in. Then click Deploy.
- Authorize the project's access to your Google account. If a warning says that the app isn't verified, select Advanced and then Go to
<your project name>(unsafe), and allow the access. - Copy the web app URL that is displayed (Ctrl + C); you will need it later. Then close the dialog.
- In the Playground app, go to the Functions tab and import this flow.
[{"id":"1fa190de.6bf34f","type":"mqtt in","z":"2c41a2bd.aa36ae","name":"","topic":"node/air-quality-monitor:0/co2-meter/-/concentration","qos":"2","datatype":"auto","broker":"d0869e74.d39d3","x":230,"y":380,"wires":[["1058eb8d.695774"]]},{"id":"fdb48a87.f1bde8","type":"mqtt in","z":"2c41a2bd.aa36ae","name":"","topic":"node/air-quality-monitor:0/thermometer/0:1/temperature","qos":"2","datatype":"auto","broker":"d0869e74.d39d3","x":240,"y":420,"wires":[["d2a76868.4a1a88"]]},{"id":"ad8c529f.84e79","type":"mqtt in","z":"2c41a2bd.aa36ae","name":"","topic":"node/air-quality-monitor:0/hygrometer/0:4/relative-humidity","qos":"2","broker":"d0869e74.d39d3","x":250,"y":460,"wires":[["92c2dca0.e7b93"]]},{"id":"f011b140.62712","type":"mqtt in","z":"2c41a2bd.aa36ae","name":"","topic":"node/air-quality-monitor:0/voc-lp-sensor/0:0/tvoc","qos":"2","datatype":"auto","broker":"a1e2fc41.c77ce","x":210,"y":500,"wires":[["5d4d663a.f49858"]]},{"id":"f6f1904c.f411e","type":"function","z":"2c41a2bd.aa36ae","name":"Data Parser","func":"msg.payload = flow.get(\"co2\") + \";\" + flow.get(\"temp\") + \";\" +\n flow.get(\"humidity\") + \";\" + flow.get(\"tvoc\");\nmsg.payload = { val: msg.payload,\n type: 'rawData'};\n msg.headers = {'content-type':'application/x-www-form-urlencoded'};\nreturn msg;","outputs":1,"noerr":0,"x":790,"y":440,"wires":[["992d7e0f.3141e"]]},{"id":"1058eb8d.695774","type":"change","z":"2c41a2bd.aa36ae","name":"","rules":[{"t":"set","p":"co2","pt":"flow","to":"payload","tot":"msg"}],"action":"","property":"","from":"","to":"","reg":false,"x":530,"y":380,"wires":[["f6f1904c.f411e"]]},{"id":"d2a76868.4a1a88","type":"change","z":"2c41a2bd.aa36ae","name":"","rules":[{"t":"set","p":"temp","pt":"flow","to":"payload","tot":"msg"}],"action":"","property":"","from":"","to":"","reg":false,"x":530,"y":420,"wires":[["f6f1904c.f411e"]]},{"id":"92c2dca0.e7b93","type":"change","z":"2c41a2bd.aa36ae","name":"","rules":[{"t":"set","p":"humidity","pt":"flow","to":"payload","tot":"msg"}],"action":"","property":"","from":"","to":"","reg":false,"x":540,"y":460,"wires":[["f6f1904c.f411e"]]},{"id":"5d4d663a.f49858","type":"change","z":"2c41a2bd.aa36ae","name":"","rules":[{"t":"set","p":"tvoc","pt":"flow","to":"payload","tot":"msg"}],"action":"","property":"","from":"","to":"","reg":false,"x":530,"y":500,"wires":[["f6f1904c.f411e"]]},{"id":"2e286fc4.213ca","type":"inject","z":"2c41a2bd.aa36ae","name":"","topic":"","payload":"-1","payloadType":"num","repeat":"","crontab":"","once":true,"onceDelay":0.1,"x":130,"y":300,"wires":[["980aadd7.47307","2e69ab31.67fa74","a6a27021.dbb98","7dd059ea.b9bd08"]]},{"id":"980aadd7.47307","type":"change","z":"2c41a2bd.aa36ae","name":"","rules":[{"t":"set","p":"co2","pt":"flow","to":"payload","tot":"msg"}],"action":"","property":"","from":"","to":"","reg":false,"x":390,"y":200,"wires":[[]]},{"id":"2e69ab31.67fa74","type":"change","z":"2c41a2bd.aa36ae","name":"","rules":[{"t":"set","p":"temp","pt":"flow","to":"payload","tot":"msg"}],"action":"","property":"","from":"","to":"","reg":false,"x":390,"y":240,"wires":[[]]},{"id":"a6a27021.dbb98","type":"change","z":"2c41a2bd.aa36ae","name":"","rules":[{"t":"set","p":"humidity","pt":"flow","to":"payload","tot":"msg"}],"action":"","property":"","from":"","to":"","reg":false,"x":400,"y":280,"wires":[[]]},{"id":"7dd059ea.b9bd08","type":"change","z":"2c41a2bd.aa36ae","name":"","rules":[{"t":"set","p":"tvoc","pt":"flow","to":"payload","tot":"msg"}],"action":"","property":"","from":"","to":"","reg":false,"x":390,"y":320,"wires":[[]]},{"id":"992d7e0f.3141e","type":"http request","z":"2c41a2bd.aa36ae","name":"","method":"POST","ret":"txt","paytoqs":false,"url":"","tls":"","persist":false,"proxy":"","authType":"","x":910,"y":280,"wires":[[]]},{"id":"d0869e74.d39d3","type":"mqtt-broker","z":"","broker":"127.0.0.1","port":"1883","clientid":"","usetls":false,"compatmode":true,"keepalive":"60","cleansession":true,"birthTopic":"","birthQos":"0","birthPayload":"","willTopic":"","willQos":"0","willPayload":""},{"id":"a1e2fc41.c77ce","type":"mqtt-broker","z":"","name":"","broker":"127.0.0.1","port":"1883","clientid":"","usetls":false,"compatmode":true,"keepalive":"60","cleansession":true,"birthTopic":"","birthQos":"0","birthPayload":"","closeTopic":"","closeQos":"0","closePayload":"","willTopic":"","willQos":"0","willPayload":""}]

- In the flow, double-click the http request node, paste your project URL into the URL field, append the following snippet to it and click Done
- The upper part of the flow with the -1 node only sets default values in case some sensors have not sent any data yet.
?val={{{payload}}}

- Click Deploy to apply the changes
- Open your Google spreadsheet: the measured values should be written into the individual columns.
- If you see the value -1 in a column, that sensor has not sent any data yet.
- At the end of the measurement, add the class timetable and the number of pupils to the spreadsheet and then present the results to the others.