Experiment
Time allocation: 10 min.
Measuring temperature and relative humidity
Experiment Description
We will use the HARDWARIO TOWER kit to build a temperature and relative humidity sensor.
The sensor will communicate with the computer through the Bridge Module plugged into a USB port. The temperature and humidity will be measured by the Humidity Tag inserted into the Bridge Module. We will display the measured data in the HARDWARIO Playground app, more precisely on the dashboard of the Node-RED environment built into it.
In this experiment, we will learn:
- how to work with MQTT messages in the Playground app
- how to set up a dashboard in the Node-RED environment
Experiment Steps
- Getting to know the Bridge Module and the Humidity Tag, building the sensor
- Installing the Playground app
- Connecting the sensor to Playground and capturing messages
- Creating a flow and setting up the dashboard
Getting to know the Bridge Module and the Humidity Tag, building the sensor
Bridge Module
The Bridge Module makes it easy to connect modules and tags from the HARDWARIO TOWER IoT kit to a computer with a USB cable. The micro USB connector carries the communication and also powers the module itself and any peripherals connected to it.
The module is built around the FT260 chip from FTDI, which converts USB HID to I²C/UART. This makes the Bridge Module an ideal tool for connecting I²C/UART peripherals.
Humidity Tag
Tag modules in the TOWER kit are designed for I²C peripherals such as sensors, memory chips or RTC circuits. They measure 16 x 16 mm.

Signal wiring on the 5-pin connector
The Humidity Tag uses the high-precision SHT20 digital humidity and temperature sensor, with a measurement accuracy of ±3% for relative humidity (in the range from 20% to 80%) and ±0.3 °C for temperature (in the range 5–60 °C).
Modules in the setup:
- Bridge Module
- Humidity Tag
- USB cable
Insert the Humidity Tag into the bottom right corner of the Bridge Module. Then connect the Bridge Module to the computer with the USB cable.
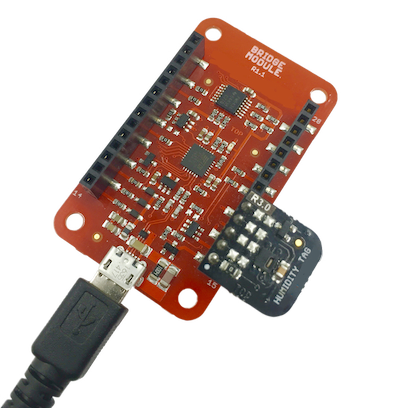
The assembly: Bridge Module and Humidity Tag
Installing the Playground app
Download the HARDWARIO Playground app and install it on your computer.
Connecting the Units to the Playground
- Plug the Bridge Module into a USB port on the computer
- Open the Playground app and go to the Bridge tab
- Click Enable Bridge
- Leave the Update interval at 5 (seconds)
- A table with the measured data appears
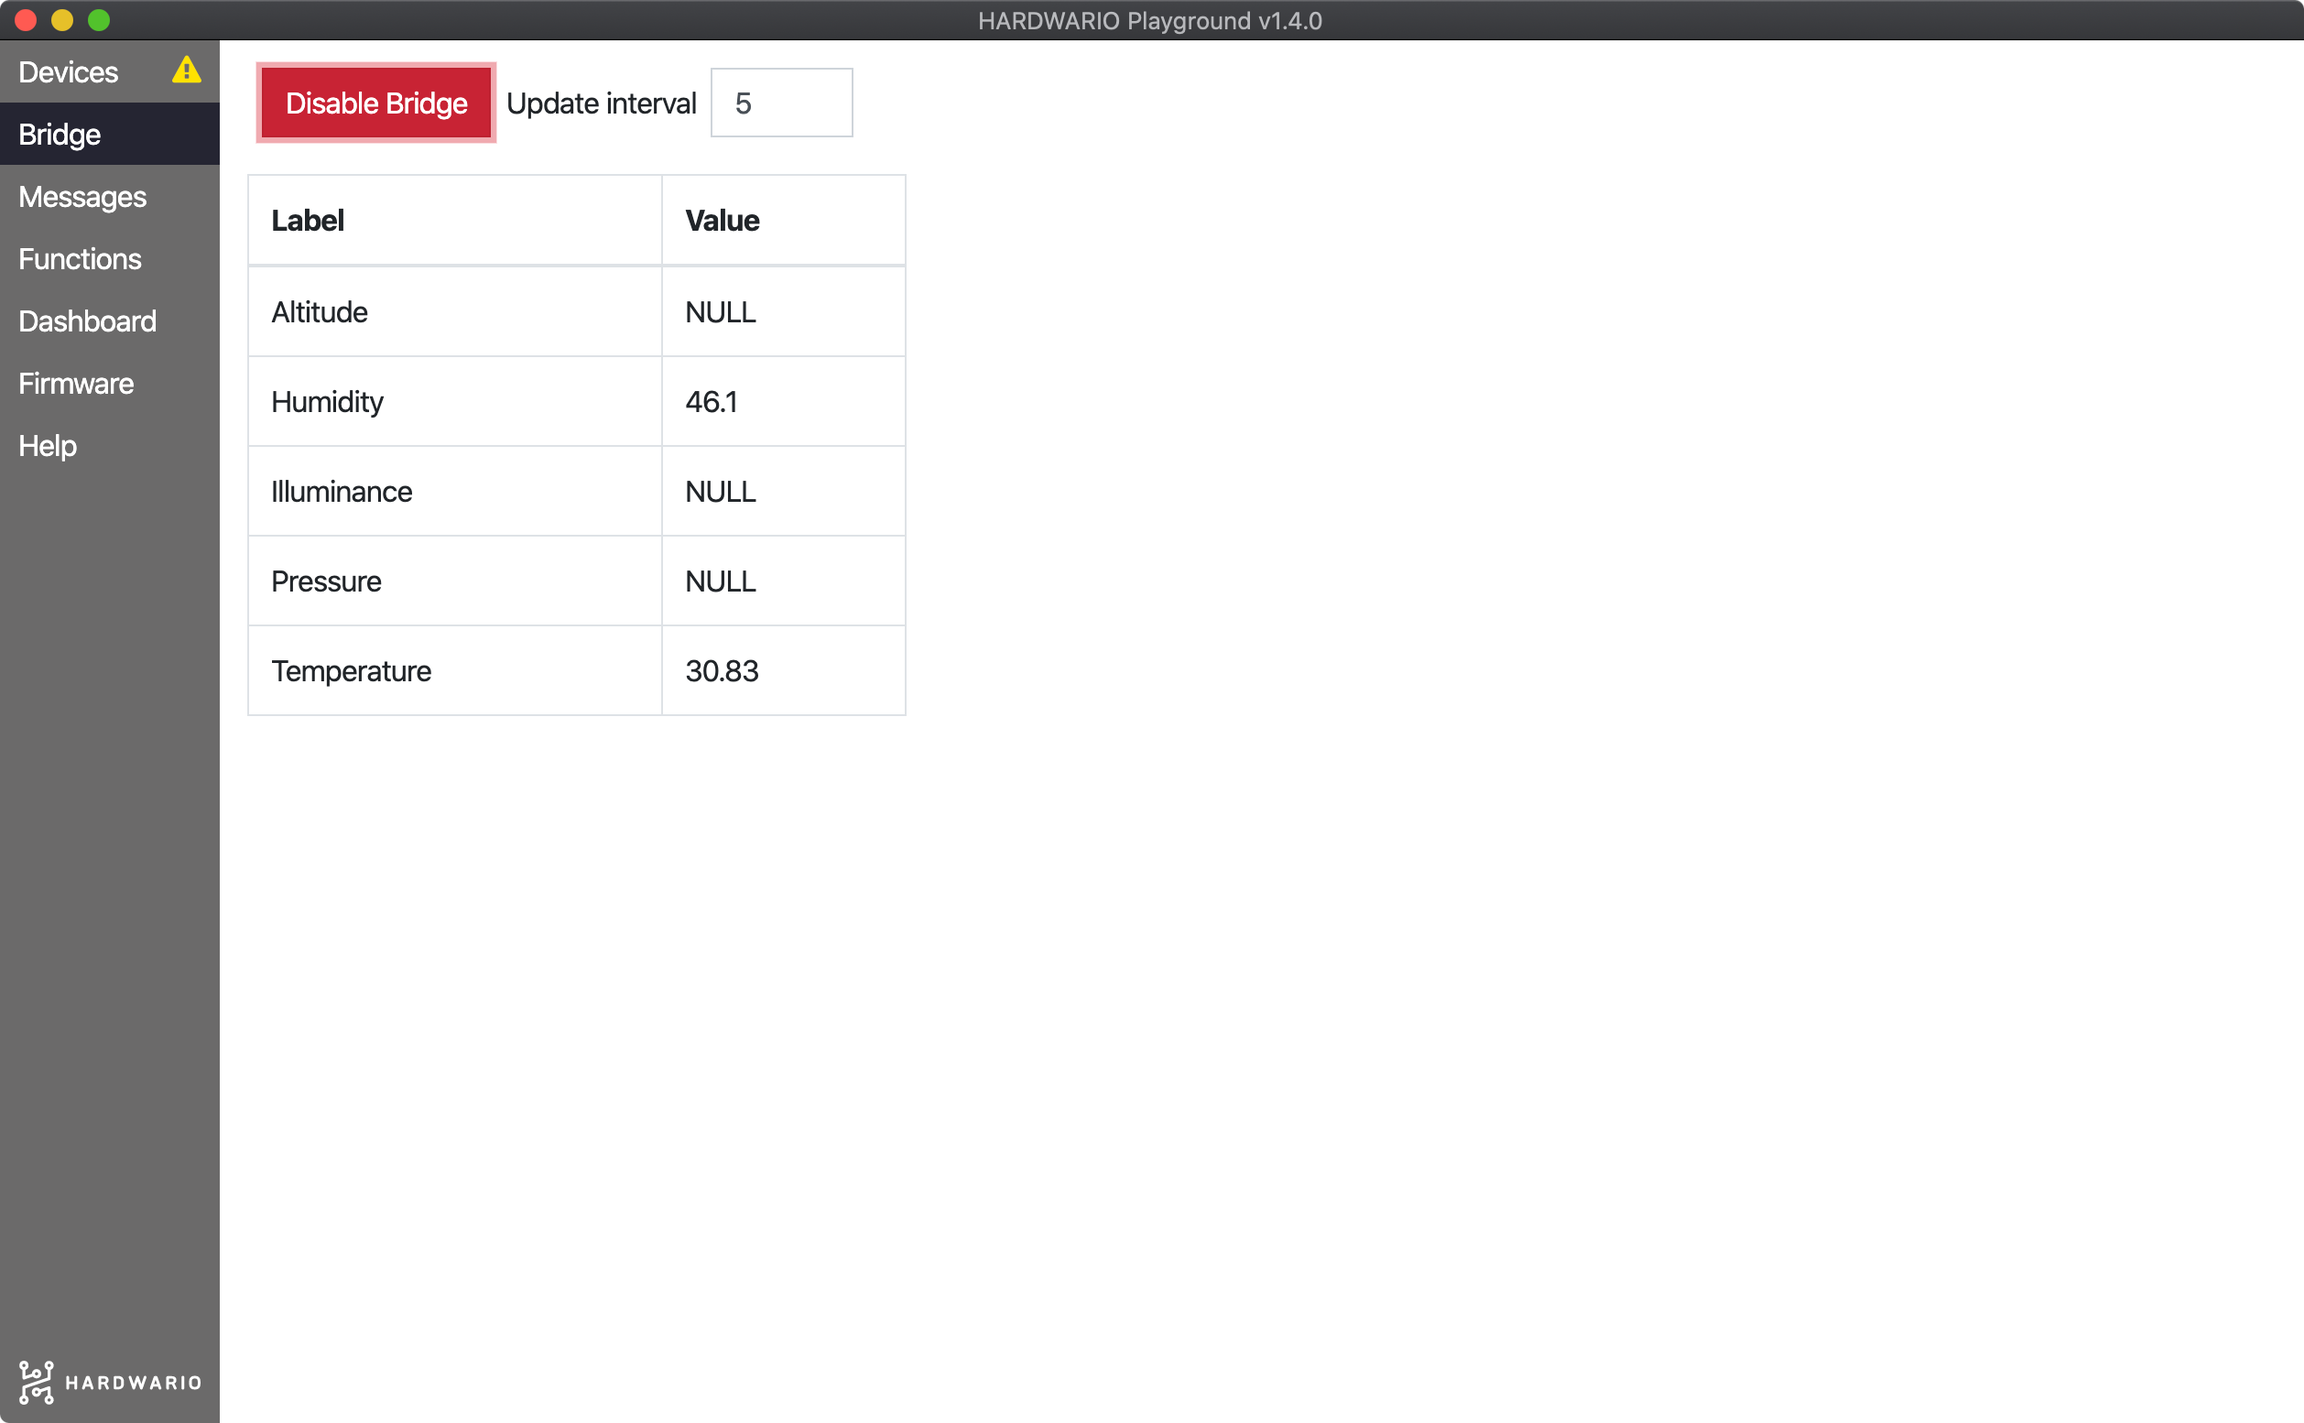
Setting up the monitoring functions and data display
- Switch to the Functions tab
- Copy this flow to the clipboard:
[{"id":"3abff9d8.b382f6","type":"mqtt in","z":"5e735a3a.6d0924","name":"","topic":"bridge/temperature","qos":"2","datatype":"auto","broker":"29fba84a.b2af58","x":150,"y":140,"wires":[["ae7df5a9.f87318","ba206b2d.1032f8"]]},{"id":"865a72d.1fca39","type":"mqtt in","z":"5e735a3a.6d0924","name":"","topic":"bridge/humidity","qos":"2","datatype":"auto","broker":"29fba84a.b2af58","x":140,"y":280,"wires":[["727425ab.1b3b8c","3f04c699.25eeea"]]},{"id":"43fed9b5.b16bc8","type":"debug","z":"5e735a3a.6d0924","name":"","active":true,"tosidebar":true,"console":false,"tostatus":false,"complete":"false","statusVal":"","statusType":"auto","x":410,"y":60,"wires":[]},{"id":"598fe371.8d843c","type":"mqtt in","z":"5e735a3a.6d0924","name":"","topic":"#","qos":"2","datatype":"auto","broker":"29fba84a.b2af58","x":110,"y":60,"wires":[["43fed9b5.b16bc8"]]},{"id":"ae7df5a9.f87318","type":"ui_chart","z":"5e735a3a.6d0924","name":"Temperature","group":"2808e3ab.f0c00c","order":0,"width":"6","height":"6","label":"Temperature","chartType":"line","legend":"false","xformat":"HH:mm:ss","interpolate":"linear","nodata":"","dot":false,"ymin":"0","ymax":"50","removeOlder":1,"removeOlderPoints":"","removeOlderUnit":"3600","cutout":0,"useOneColor":false,"useUTC":false,"colors":["#1f77b4","#aec7e8","#ff7f0e","#2ca02c","#98df8a","#d62728","#ff9896","#9467bd","#c5b0d5"],"useOldStyle":false,"outputs":1,"x":410,"y":140,"wires":[[]]},{"id":"727425ab.1b3b8c","type":"ui_chart","z":"5e735a3a.6d0924","name":"Humidity","group":"2808e3ab.f0c00c","order":0,"width":0,"height":0,"label":"Humidity","chartType":"line","legend":"false","xformat":"HH:mm:ss","interpolate":"linear","nodata":"","dot":false,"ymin":"0","ymax":"100","removeOlder":1,"removeOlderPoints":"","removeOlderUnit":"3600","cutout":0,"useOneColor":false,"useUTC":false,"colors":["#1f77b4","#aec7e8","#ff7f0e","#2ca02c","#98df8a","#d62728","#ff9896","#9467bd","#c5b0d5"],"useOldStyle":false,"outputs":1,"x":400,"y":280,"wires":[[]]},{"id":"ba206b2d.1032f8","type":"ui_gauge","z":"5e735a3a.6d0924","name":"Temperature","group":"6815d7cb.7800e8","order":2,"width":0,"height":0,"gtype":"gage","title":"Temperature","label":"°C","format":"{{value}}","min":0,"max":"50","colors":["#00b500","#e6e600","#ca3838"],"seg1":"25","seg2":"30","x":410,"y":200,"wires":[]},{"id":"3f04c699.25eeea","type":"ui_gauge","z":"5e735a3a.6d0924","name":"Humidity","group":"6815d7cb.7800e8","order":2,"width":0,"height":0,"gtype":"gage","title":"Humidity","label":"%","format":"{{value}}","min":0,"max":"100","colors":["#00b500","#e6e600","#ca3838"],"seg1":"40","seg2":"60","x":400,"y":340,"wires":[]},{"id":"29fba84a.b2af58","type":"mqtt-broker","z":"","broker":"127.0.0.1","port":"1883","clientid":"","usetls":false,"compatmode":true,"keepalive":"60","cleansession":true,"birthTopic":"","birthQos":"0","birthPayload":"","willTopic":"","willQos":"0","willPayload":""},{"id":"2808e3ab.f0c00c","type":"ui_group","z":"","name":"Default","tab":"3e10db66.c8f514","order":1,"disp":true,"width":"6","collapse":false},{"id":"6815d7cb.7800e8","type":"ui_group","z":"","name":"Default","tab":"d96f0e09.23f3c","order":1,"disp":true,"width":"6","collapse":true},{"id":"3e10db66.c8f514","type":"ui_tab","z":"","name":"Charts","icon":"dashboard","disabled":false,"hidden":false},{"id":"d96f0e09.23f3c","type":"ui_tab","z":"","name":"Gauges","icon":"dashboard","disabled":false,"hidden":false}]
- In the top right corner, you will find the hamburger menu with the Import item

- Paste the copied flow from the clipboard into the field that appears and click Import
- Click Deploy to apply the changes
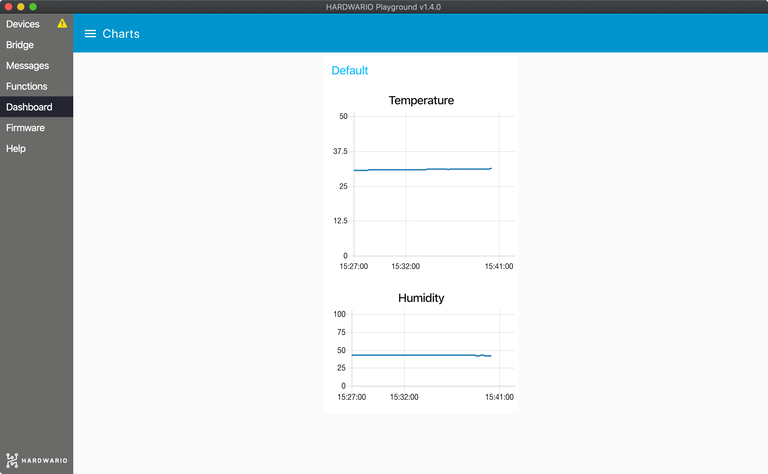
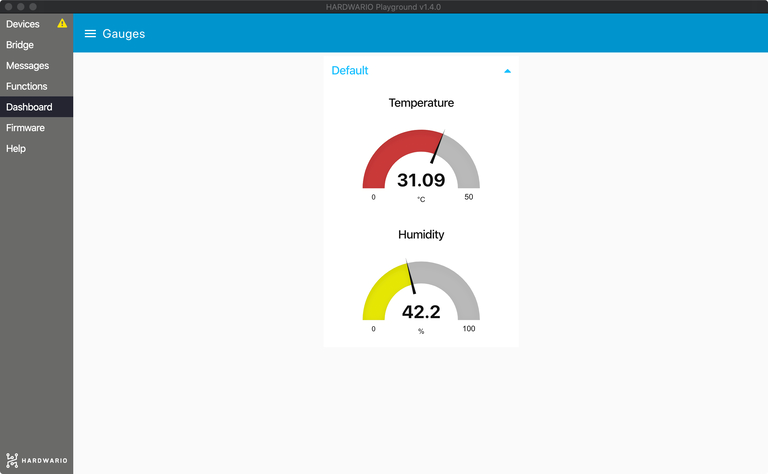
- Switch to the Dashboard tab. If everything went well, you will see two sections in the menu, Charts and Gauges, with charts and gauges of the temperature and humidity.
Note:
When you breathe on the Humidity Tag, you will see the temperature and humidity values change in real time.